
Kp-index forecast
~1-hour forecast
Click on image to enlarge
Information
The Kp ~1 hour forecast and last 24 hour overview is calculated based on the method developed by Andonov et al. (2004) in their paper “Analogue model, relating Kp index to solar wind parameters” (DOI: 10.1016/j.jastp.2004.03.006). The method which is referred to as the MAK-method after the authors, uses time shifted solar wind data (IMF, pressure and velocity) from L1 as input. The technique relies on an approach to the the solar wind magnetosphere interaction which is analogue to an electric diode rectifier circuit. We refer to the paper for more details.
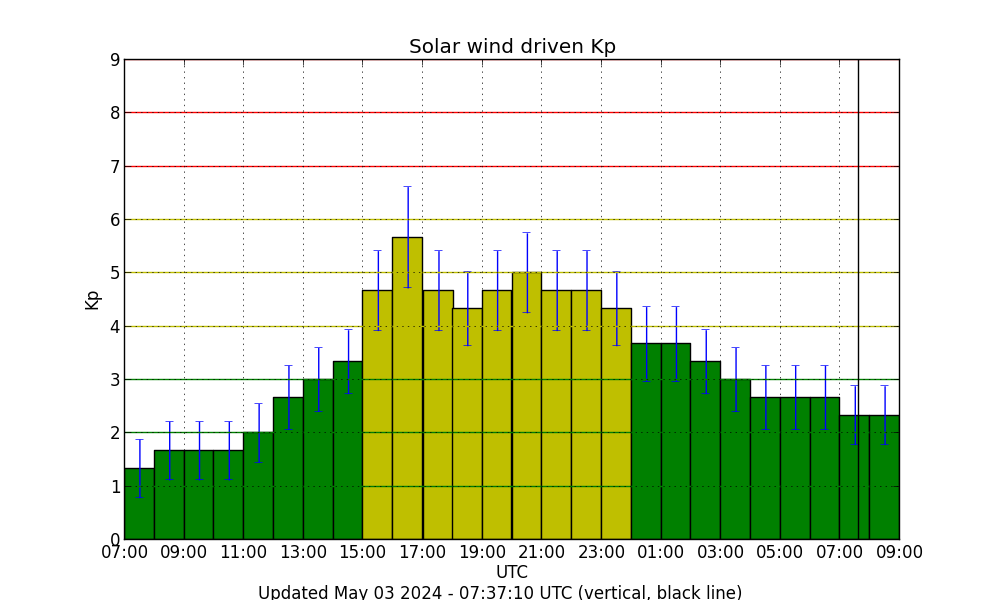
The plot shows the calculated Kp for the last 24 hours in one hour steps as well as a ~1 hour prediction. The prediction lead time is given by the transit time of the solar wind from L1 to Earth. The current time is indicated as a vertical, black line in the plot. At the bottom of the plot, the time of generation (and the black line) is given. The colour of the bars is green for Kp 7. Each bar is fitted with error margins corresponding to the average root mean square deviation between the observed and modelled Kp as provided by Andonov et al. (2004)
Note that, although data reprocessing occurs once every 12 minutes, the figures on the webpage are not automatically updated and a refresh is necessary to show the most updated figures.
We thank Borislav Andonov at the National Institute of Geophysics, Geodesy and Geography, Bulgarian Academy of Science, for assistance and advice when implementing the MAK method in the current product.
Acknowledgement
These results are very much based on projects that received funding from the ESA Space Situational Awareness Programme’s network of space weather service development activities under ESA contract number 4000113185/15/D/MRP.
All publications and presentations using data obtained from this site should acknowledge the Norwegian Centre for Space Weather at Tromsø Geophysical Observatory and the ESA Space Situational Awareness Programme.