Category: Cruise blog

  • What’s lurking on top of the below

    What’s lurking on top of the below

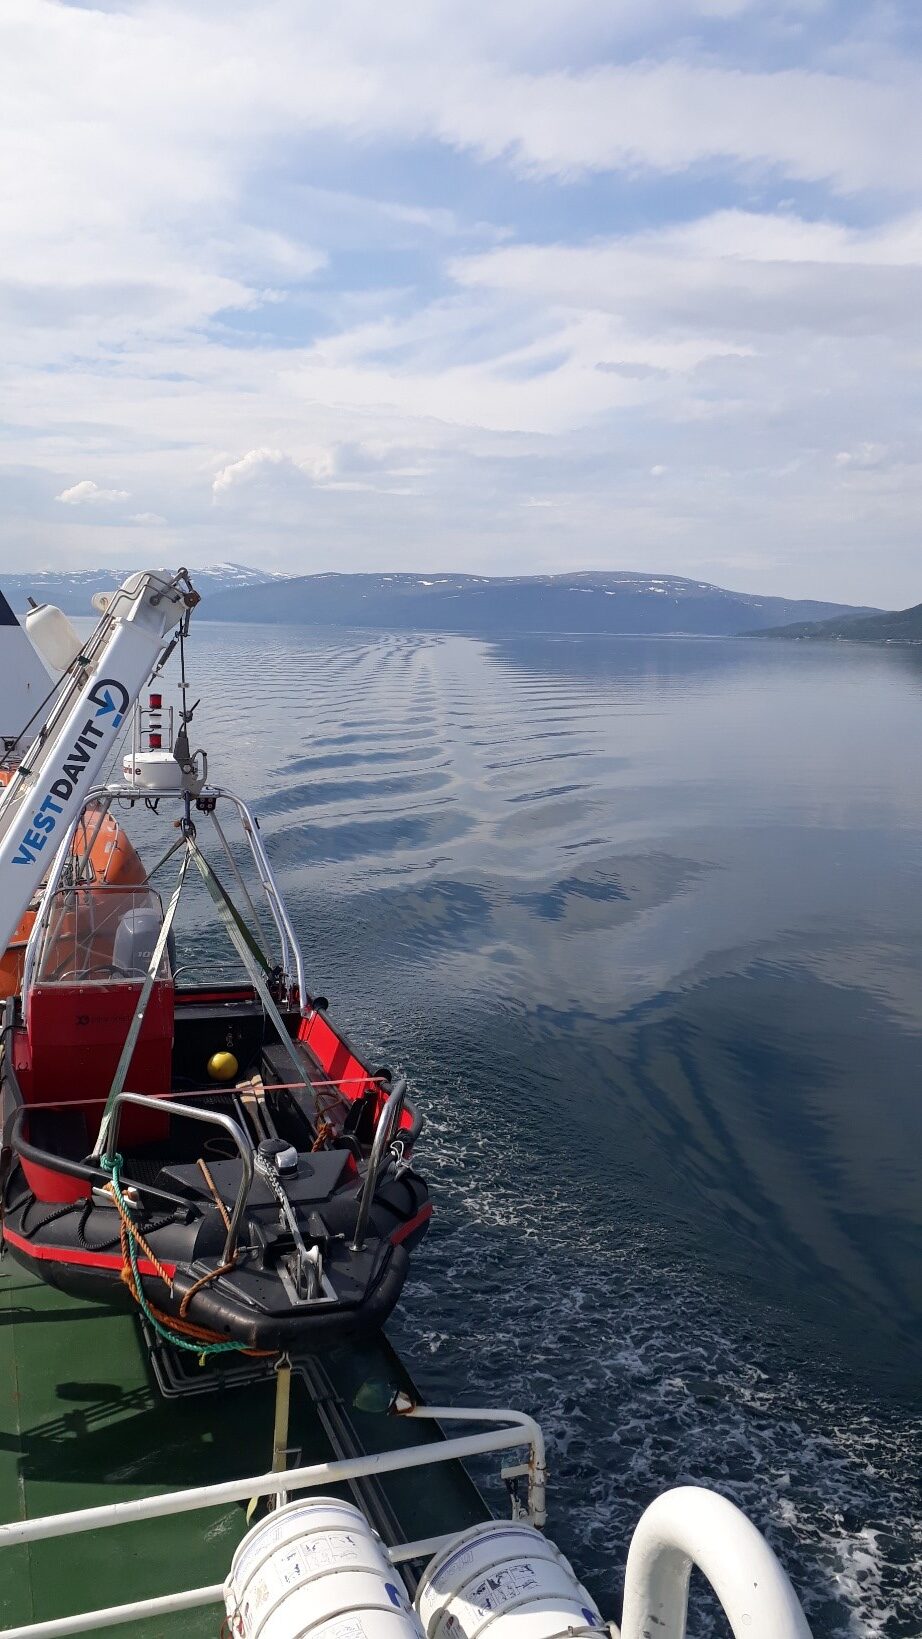
    Greetings from onboard the R/V Helmer Hanssen, where we are exploring the Barents Sea in the region south of Svalbard. The quest for mapping territory has driven explorers and scientists for centuries, and for us on this cruise it is no different. Our domain of exploration extends south and southeast of Svalbard, in the regions called Spitsbergenbanken, Hopendjupet, Nordflaket, and Bjørnøyrenna. The objectives of this 18-day expedition, “CAGE-22-6-HH”, are manifold but the main aim is to map and study sites of fluid flow on the seafloor, which can be related to natural methane and gas seeps, and link to their geological setting.

    Sunday 14th August 2022

    Text: Grace Shepard

    Figure 1: Overview of the bathymetry of the Barents Sea and cruise-track thus far. We departed Longyearbyen on August 2nd 2022 and expect to arrive in Tromsø on August 20th.

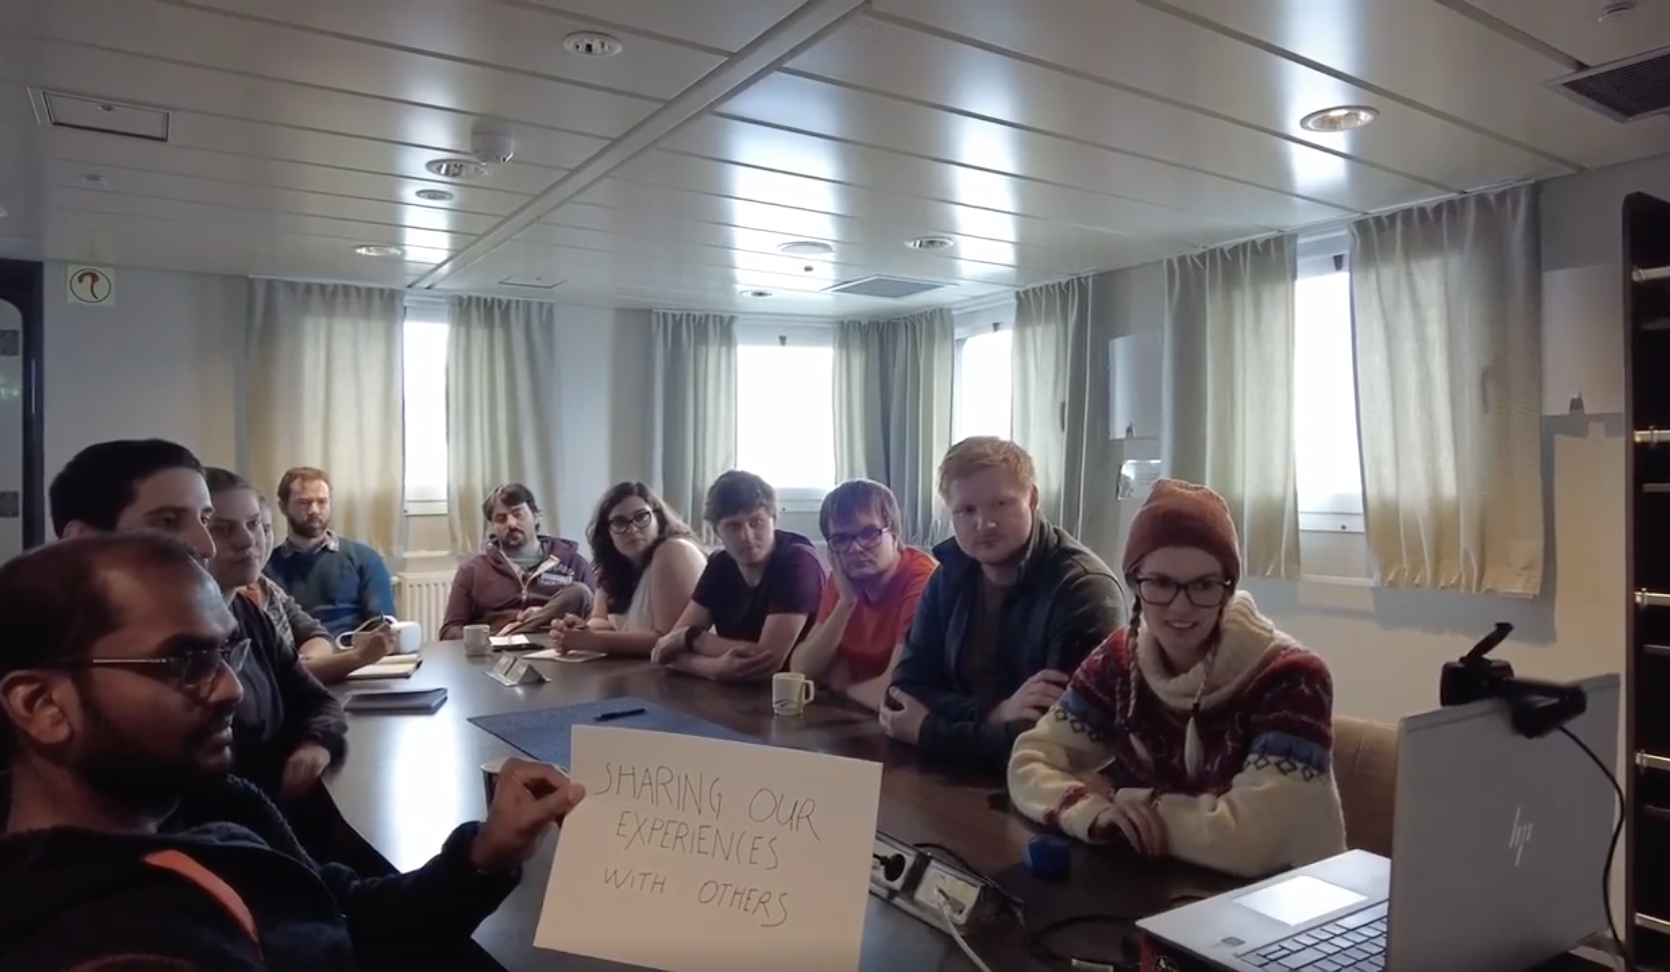
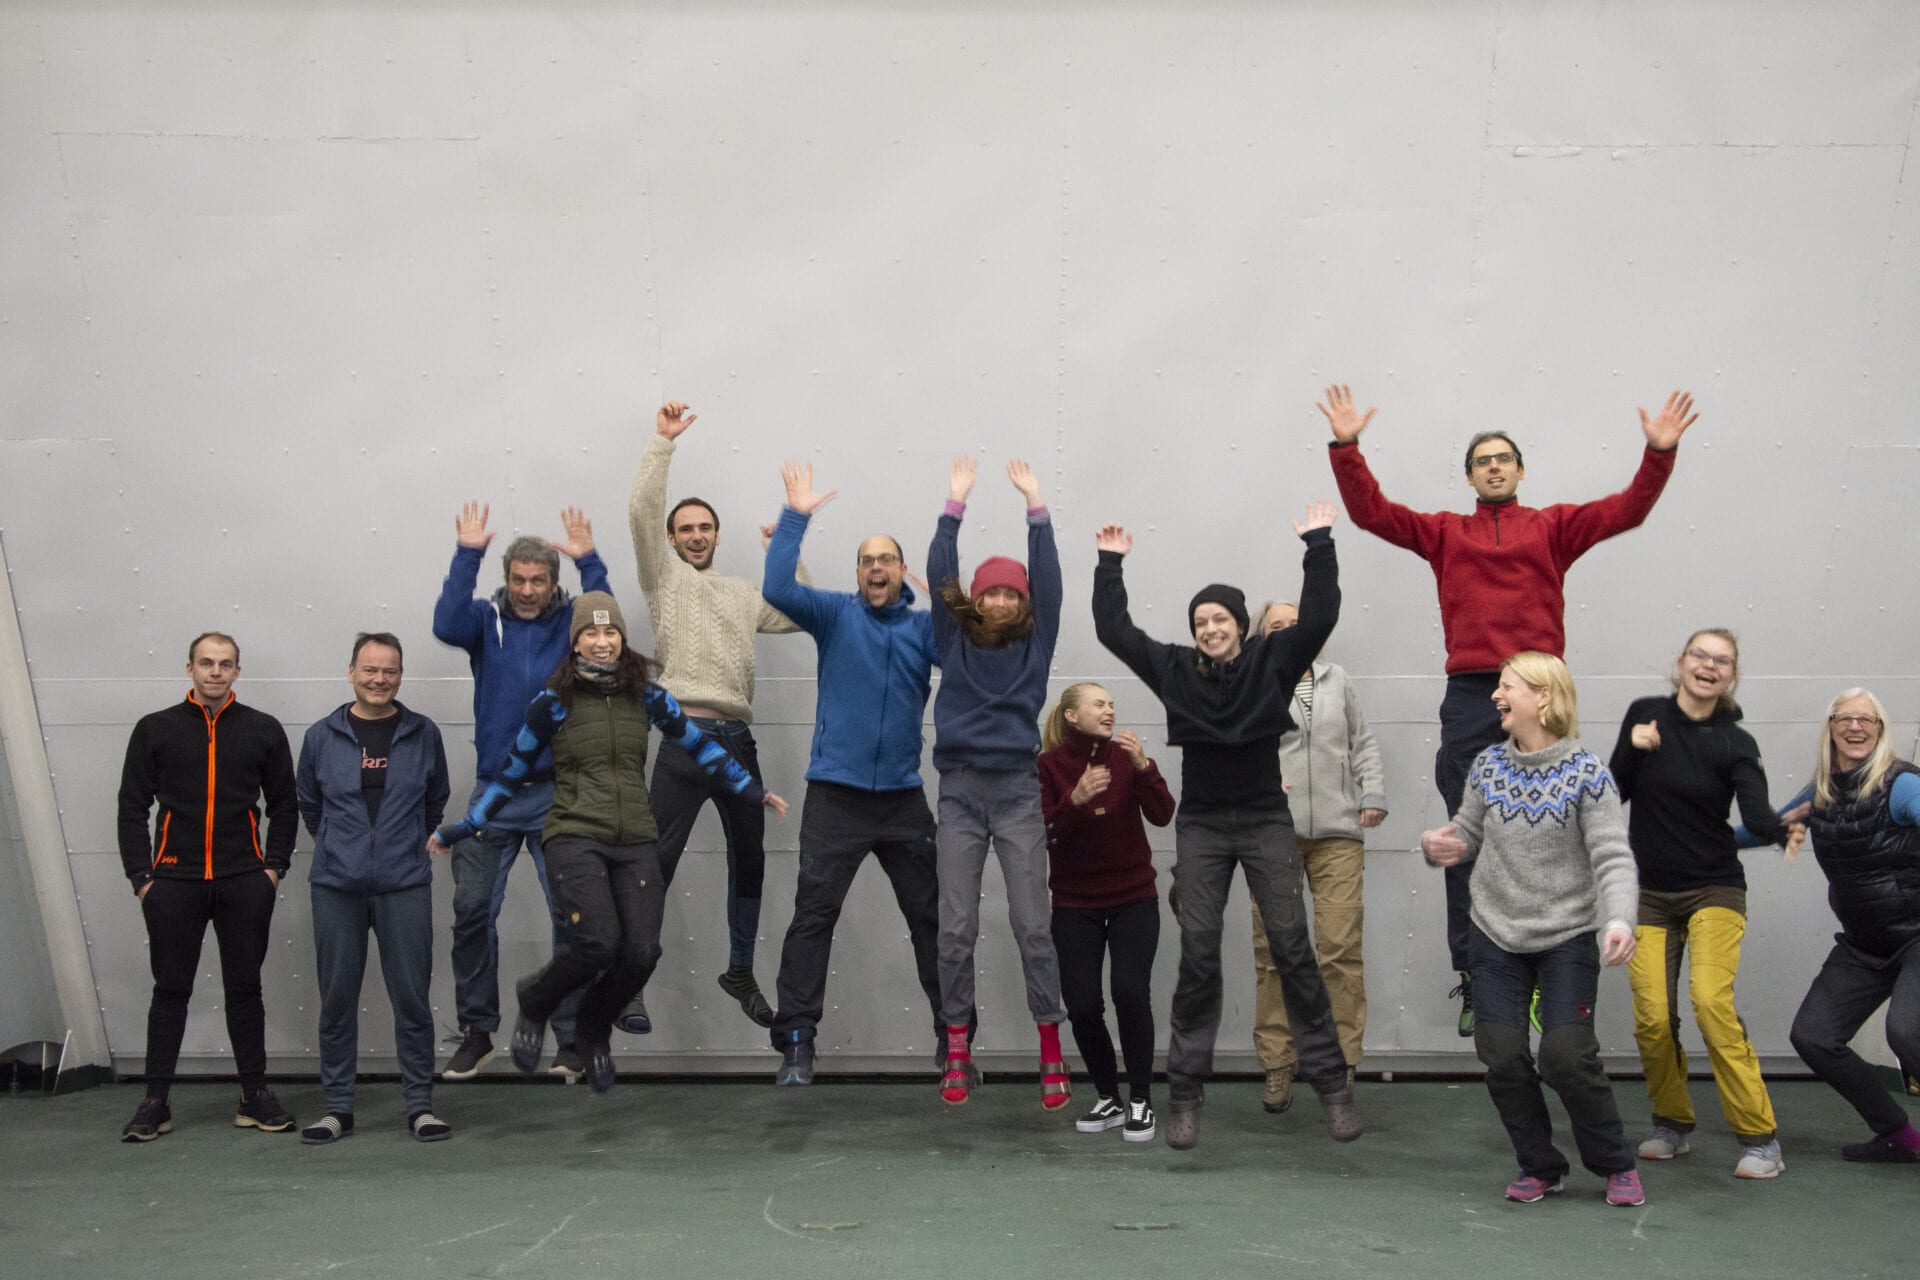
    It is also an educational cruise, both as a UiT and UiO field course (GEO-x144) and a UNESCO Teaching-Through-Research course (TTR-22). There is therefore a heavy hands-on and two-way educational component between the students and senior scientists onboard.

    We are a scientific party of 13 people, plus two instrument engineers, and the ship’s crew. We are 10 nationalities – Australia, Brazil, Britain, Columbia, Denmark, Italy, Germany, Norway, Russia – and from four universities (UiT, UiO, Bologna and Kiel). Onboard, there are experts on seismology, glaciology, marine geology and geophysics, oil and gas processes, paleontology, mud volcanos, oceanography, plate tectonics, numerical modelling, seismic hazards, gas hydrates, methane emissions, and more, so there is plenty of science to be exchanged.

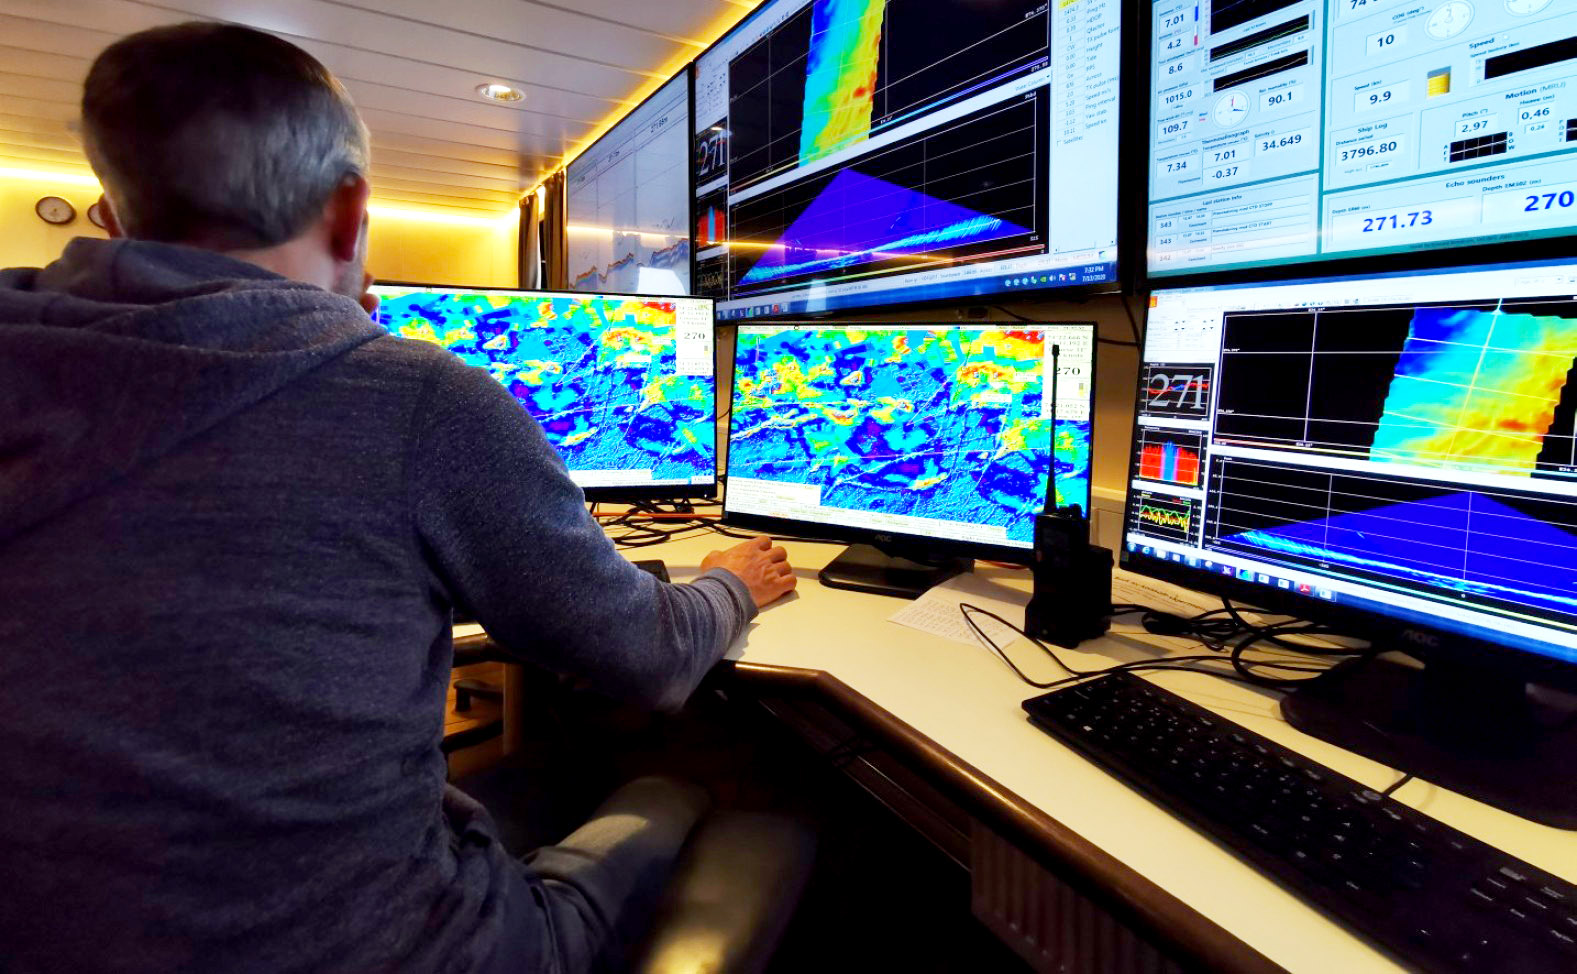
    Figure 2: PhD candidate Juan Camilo Meza Cala in the instrument room looking for gas flares. The bottom triangular window on his screen even shows a flare (yellow feature in the middle dipping to the bottom right).

    Three of us onboard are from a “sister” Centre of Excellence in Norway – The Centre for Earth Evolution of Dynamics (CEED) at the University of Oslo – which was established in the same funding round as CAGE (2013-2023). Our centres have already collaborated a few times before for expeditions, research and education, and it is a pleasure to combine forces once more whilst both centres still exist!

    On a regular work day, I study the past configuration of landmasses and oceans – also known as plate tectonics. I have a particular interest in the formation of the Arctic and North Atlantic, as well and the processes occurring in the deep interior of the Earth (down to 2900 km below our feet). To do this, I typically look at timescales of tens or hundreds of millions of years in the past, so a switch to more “recent” glacial and Holocene sedimentation timescales is a welcome change. I just have to drop a few zeros from the 100,000,000 years, and we’re in business!

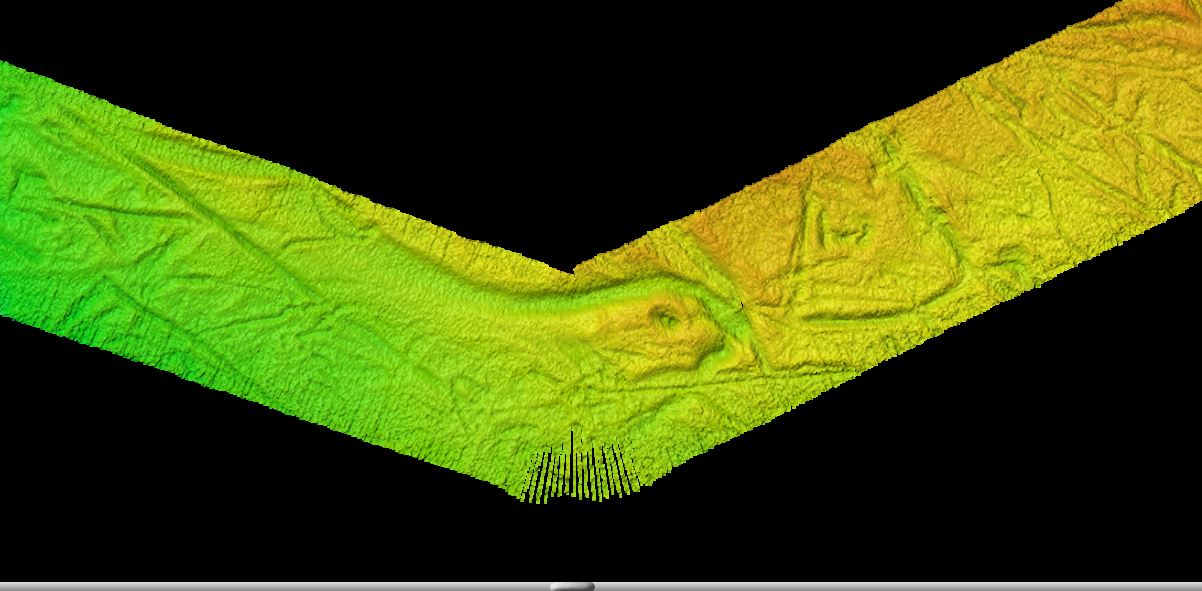
    Figure 3: Some of the newly mapped features on the seafloor. Including a) annual sedimentary deposits from past glacial channels, b) “hill-hole” pairs possibly formed when sediment blocks freeze onto the base of the ice sheet before being dumped downstream, and c) some of the many iceberg scours that wiggle in all directions. These images are made from the multibeam data as the ship passes overhead and are loaded into the software, Fledermaus.

    It follows that when I think of “seafloor” processes, I usually strip away the topmost sedimentary cover to look at the rock layers below, but on this particular cruise I have discovered for myself an exciting world of features on the very top of the bottom.

    The ship’s multi-beam instrument maps out the depth to the seafloor (bathymetry), which in turn reveals many bumps and holes of different sizes and shapes. Many of the (presumably) glacial features are probably very familiar to the long-term readership of this blog, but they are quite new to me. It is quite fun to see them being mapped out for the first time at this resolution, and in real-time too. It is also a reminder about the constant state of change occurring across our planet at all sorts of time-scales, no matter the number of zeros!

    Figure 4: A zoomed-in and 3-D perspective (vertical exaggeration) of the multi-beam seafloor data as shown in plot c of Figure 3. A profile running across the path reveals some of the highs and lows.
     

    Dr. Grace E. Shephard
    grace.shephard@geo.uio.no
    Researcher
    Centre for Earth Evolution and Dynamics (CEED)
    University of Oslo
    Twitter: @CEEDOslo @PolarisArctic @ShepGracie
    Insta: @ceedoslo @polarisdigitalarctic
  • Stressed seeps under pressure

    Stressed seeps under pressure

    Text: Bénédicte Ferré

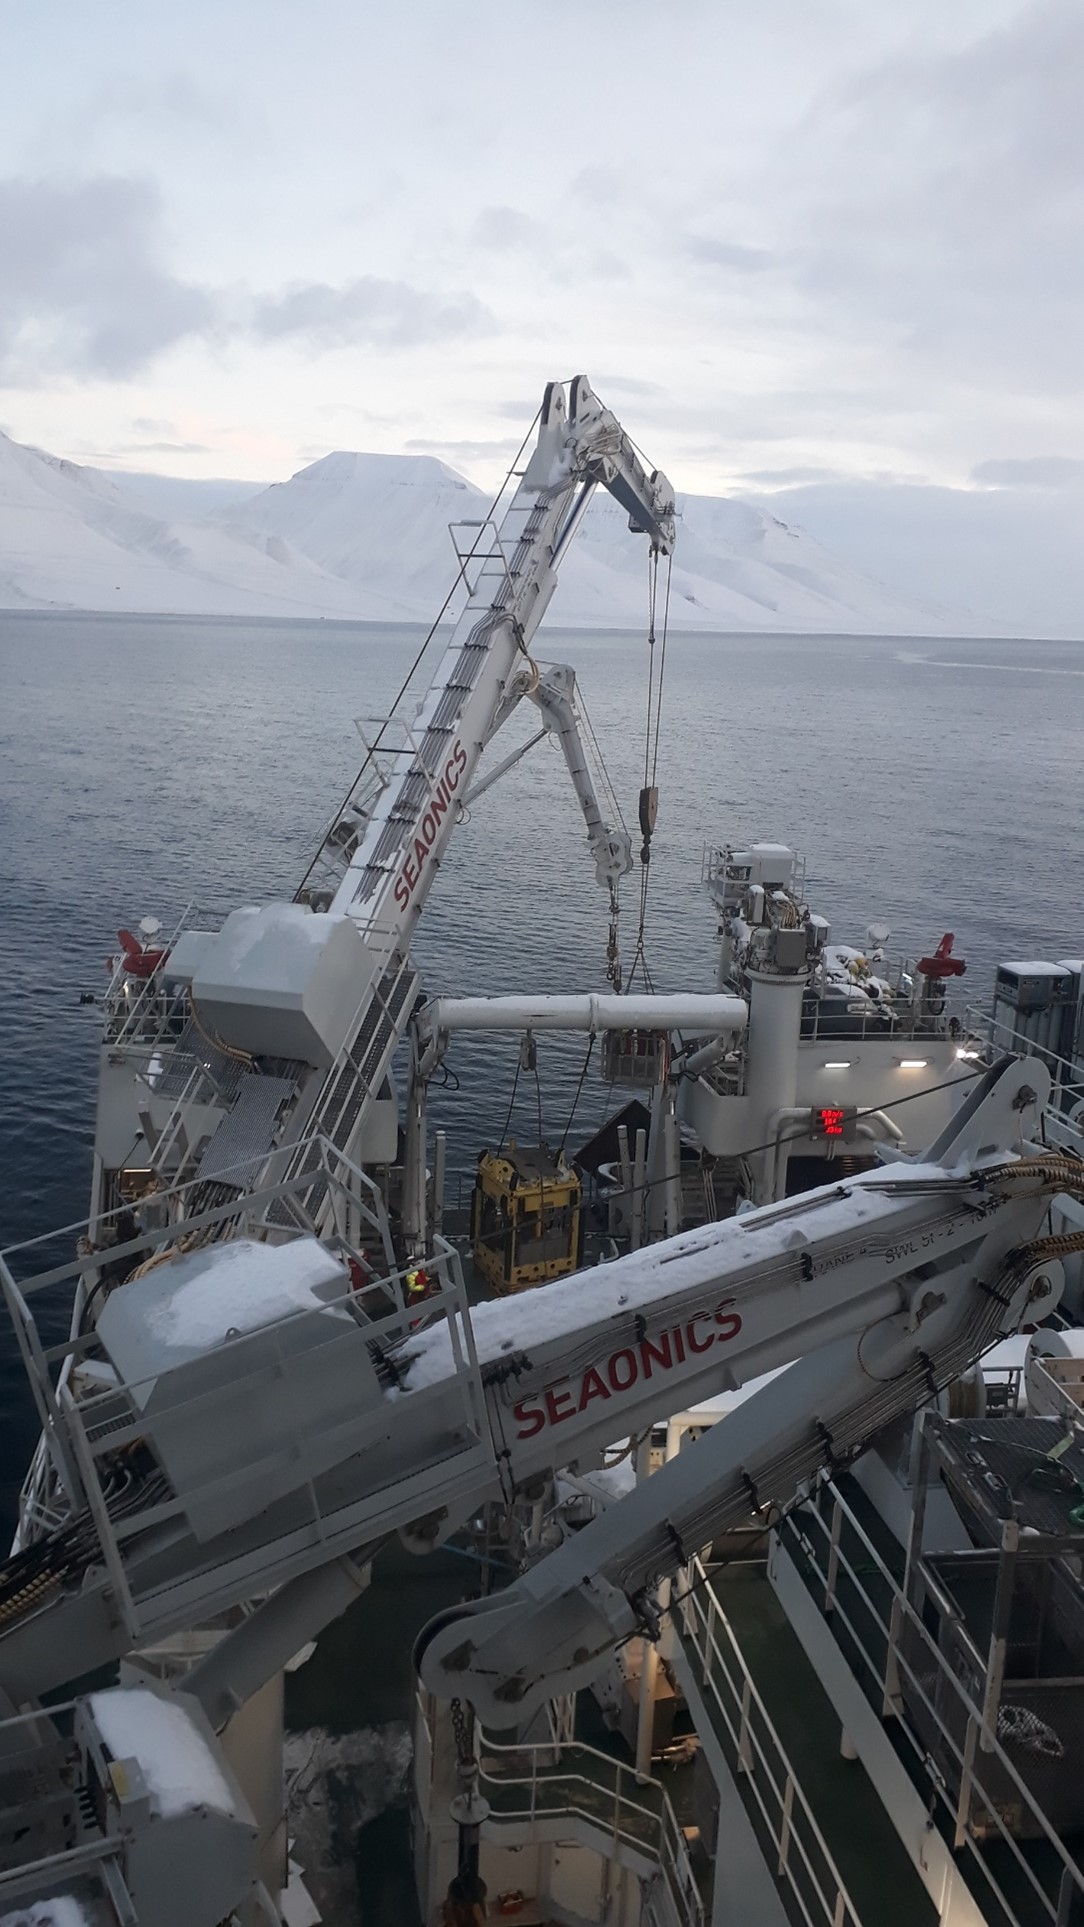
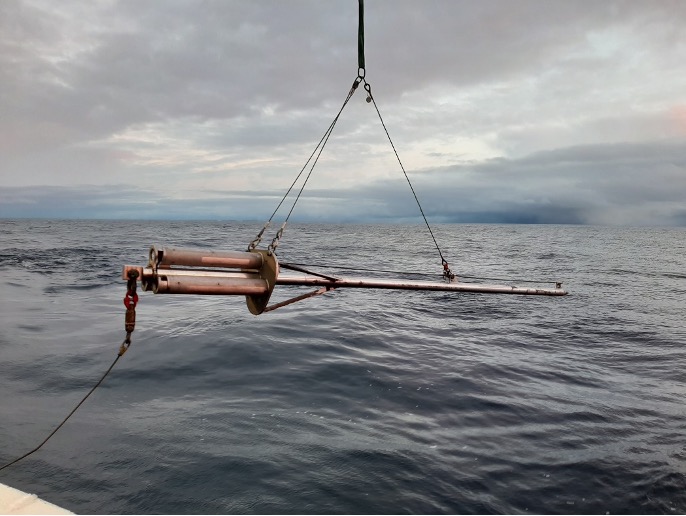
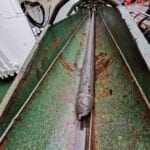
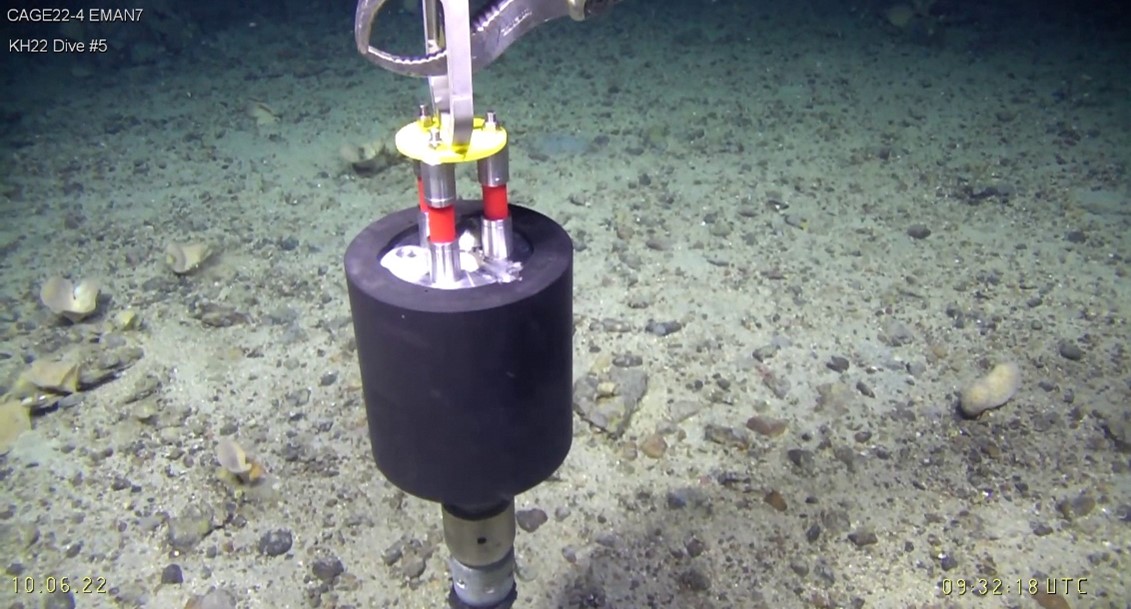
    One of our operations was to deploy two piezometers in order to monitor the pore pressure within the sediment near the seeps, an operation lead by Thibaut Barreyre at UiB. We used a huge 4-tons rig to deploy this thin 3-m long equipment. The operation requires the ROV to detach the weights from the rig that releases the piezometer onto the sediment, and once the rig is lifted back up from the ship, the ROV installs the datalogger that will keep collecting data for 511 days. The data will then be analyzed and used to unravel the subseafloor permeability, to ultimately constrain how much methane is released from the seabed to the overlying ocean.
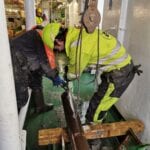
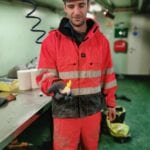
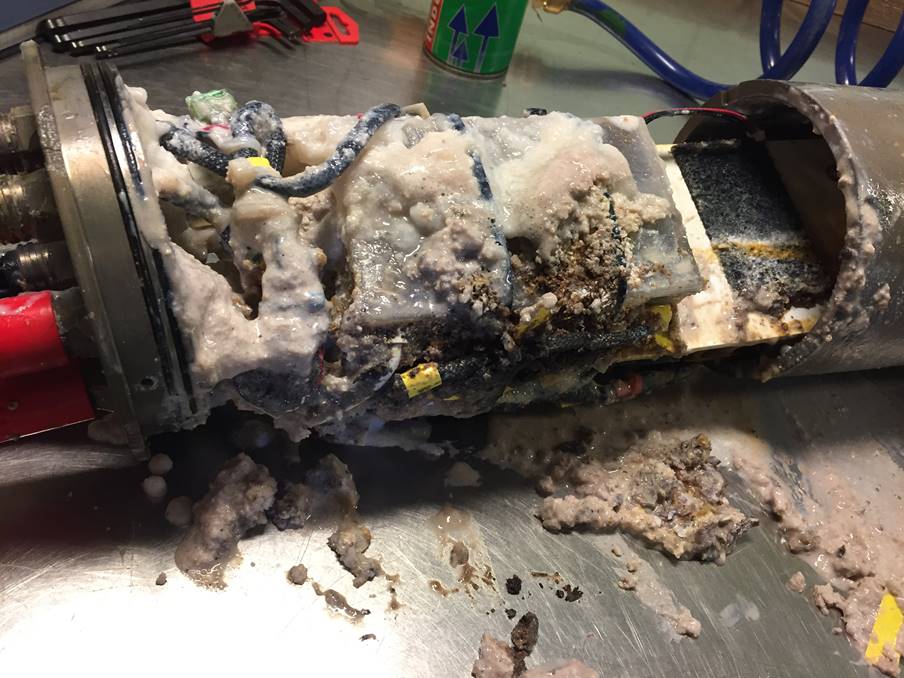
    And sometimes sciences means improvising, here is how we clean dirty piezometers at a 250m deep site… and it worked!

    Rig used to deploy the piezometers.

    The ROV releases the weights so the standpipe penetrates the sediment.
    The ROV has installed the datalogger on the standpipe.

    This is not rocket science, but it does the job.

  • Cohabitation of methane seeps and coral reef

    Cohabitation of methane seeps and coral reef

    Text: Bénédicte Ferré

    The project EMAN7 (Environmental impact of Methane seepage and sub-seabed characterization at LoVe – Node 7) consists in a consortium between UiT, UiB and IMR. Our main mission is to understand how oceanic parameters and climate change influence methane seepage from the seafloor, and the subsequent impacts on ecosystem health. Node 7, one of the 7 nodes installed in the frame of the project Lofoten-Vesterålen Ocean Observatory (LoVe), is deployed in a seepage area. Only 180m north of these seeps lives a large and healthy cold water coral reef. Why are these coral reefs thriving there despite a possible ocean acidification due to methane emission? What is influencing this release and how does it influence the surrounding sub-seafloor and water column? How long has the methane been leaking there? Where does it go? How much carbon is expelled from the seafloor? We are trying to answer these questions using the long time series collected from the node, and also from data collected during our current cruise.

    We are used to chasing flares during our cruises at CAGE, but this time we also look for corals. These beautiful submarine flowers cover part of the floor at Hola trough, and one of the teams, led by Tina Kutti from IMR, collects them to understand the effect of CH4 seeps on cold water coral reef communities and their capacity for adaptation. Answering this is impossible in lab environment because these are extremely long -lived species that require decades of exposure to reveal their true stress response.

    Cold water coral reef near node 7 in Hola trough.

  • Welcome aboard our virtual research cruise!

    Welcome aboard our virtual research cruise!

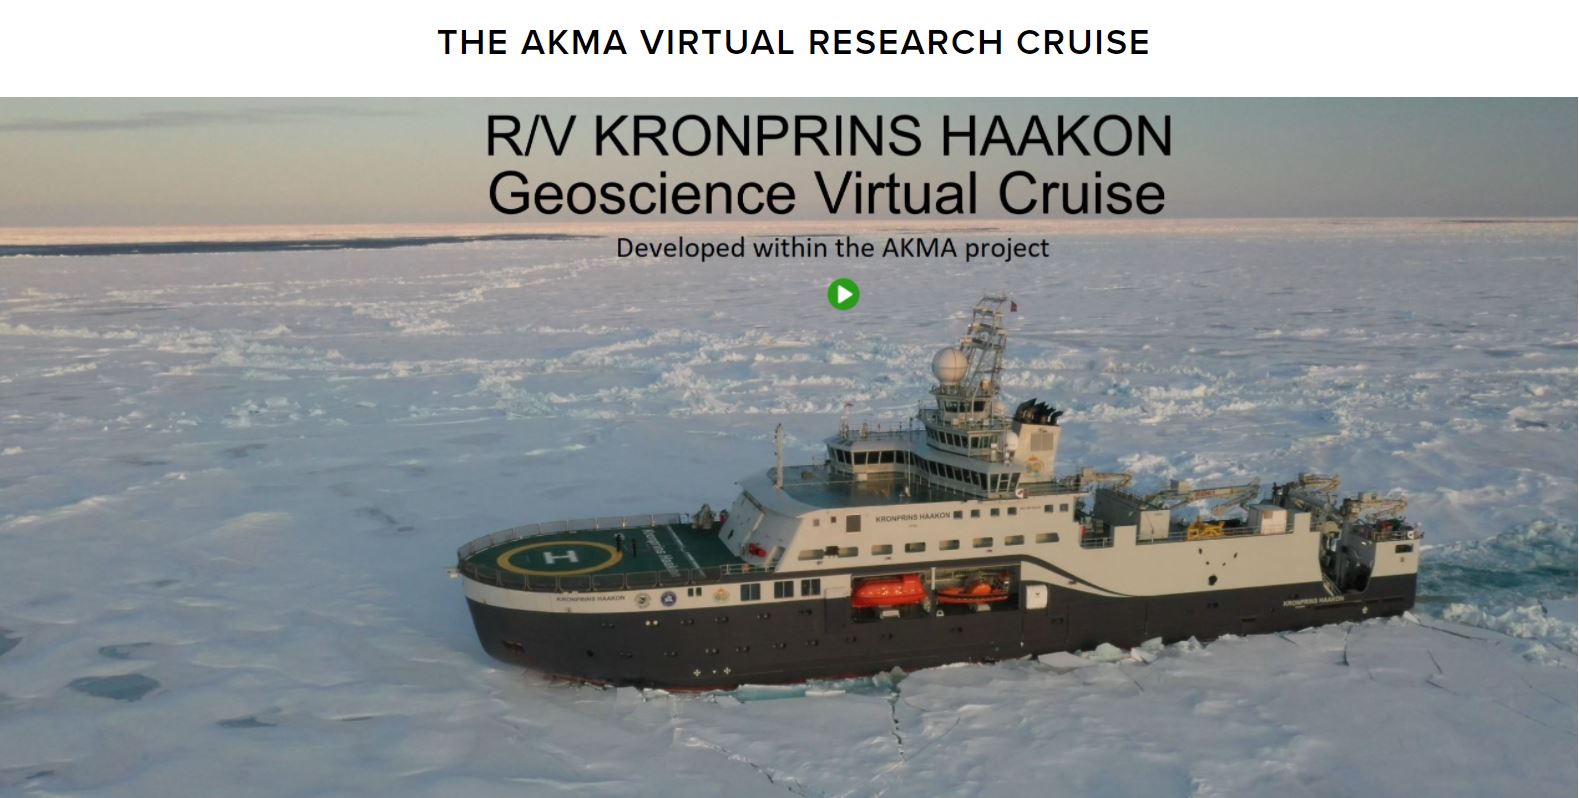
    Have you ever dreamt of sailing into the Arctic and taking part in a research cruise? Have you ever wondered how scientists live and work when out at sea? Have you ever wondered how the R/V Kronprins Haakon looks like inside?

    If so, then look no further and check out the new AKMA project virtual research cruise!

    Text: Mariana Esteves

    The pandemic affected us all globally and so, when many of the participants for the first AKMA (Advancing Knowledge of Methane in the Arctic) cruise were unable to join the cruise Covid-19 restrictions, the idea to develop the virtual research (VR) cruise was born. Students and researchers from AKMA project, CAGE and UiT worked together to film and create an educational tool that can be used by anyone who wants to know what it is like to be a scientist on an Arctic research expedition.

    “We all know that real expeditions are unique, but the virtual one can be used for teaching, outreach, to prepare participants in getting familiar with the environment on-board, and for people with disabilities that differently could not join an expedition.” Says Giuliana Panieri, the leader for the AKMA project and cruise.

    The VR cruise on-board the R/V Kronprins Haakon can be explored both online through the web browser or with a virtual reality headset.  A total of 10 virtual reality headsets are available for schools to borrow, and they have already ventured around Europe and the world allowing students from several schools to explore the R/V Kronprins Haakon and virtual cruise. This is a unique experience for people of all ages, from school children to adults, to experience being on a research cruise and feel inspired for polar research.

    To find out more information on the virtual research cruise and how your school or research institute can get involved with this initiative, click here.

    To read the reflections of a project leader during the AKMA cruise, click here.

  • In-situ horizontal pressure measurements at deep marine seafloor methane emission off west-Svalbard

    In-situ horizontal pressure measurements at deep marine seafloor methane emission off west-Svalbard

    Why gas emissions from the seafloor have stopped thousands of years ago in some areas along the Vestnesa sedimentary ridge, while persisting exclusively on the eastern part of the ridge, is the question that drives our scientific objectives in this campaign.


    Text: Andreia Plaza-Faverola, leader. SEAMSTRESS project.


    The answer to this question is likely related to the type of sediment and the disposition of the sediment to fracture. To investigate this further we need to measure sediment properties such as in-situ pore fluid pressures, horizontal stress and shear strength. Conducting these measurements is not so easy because it requires expensive and technically challenging instrumentation. The SEAMSTRESS project assumes the challenge of conducting the geotechnical experiments that are lacking to understand the pressure behavior at deep marine seafloor seepage systems in our favorite Arctic laboratory: The Vestnesa Ridge. These challenging experiments are the core of SEMSTRESS which main objective is to advance knowledge on the pressure (stress) field that controls seafloor methane emissions.

    In a collaboration with MSH – Marine Sampling Holland and the Marchetti laboratory we are planning to deploy the Medusa dilatometer designed by the Marchetti Lab to measure in-situ the pressure of the Earth at ease and therefore the horizonal stress. To deploy this instrument offshore there is need for a seafloor sort of rig. We intend to use Geomil’s Manta 200 rig, an instrument designed for conducting cone penetration tests in the soil. Geomil started developing this type of instrumentation in the 30s to help the Netherland overcome a struggle with railway failures due to soft sediment.

    Manta is a big machine, heavier than anything that has been deployed so far from R/V Kronprins Haakon. The machine also has a power supply requirement that differs from what the ship can provide. Our mission therefore starts with a few days in the fjord working hard to overcome all the technical challenges to get the machine ready for deployment before sailing offshore.


    The Geomil’s Manta-200 rig for Cone Penetration Test (CPT) in position while the MSH team together with the ship crew prepare the winches and solvent challenges with the power supply.

  • Return from the forest of the 10,000 flares

    Return from the forest of the 10,000 flares

    Text and photos: Mauro Pau

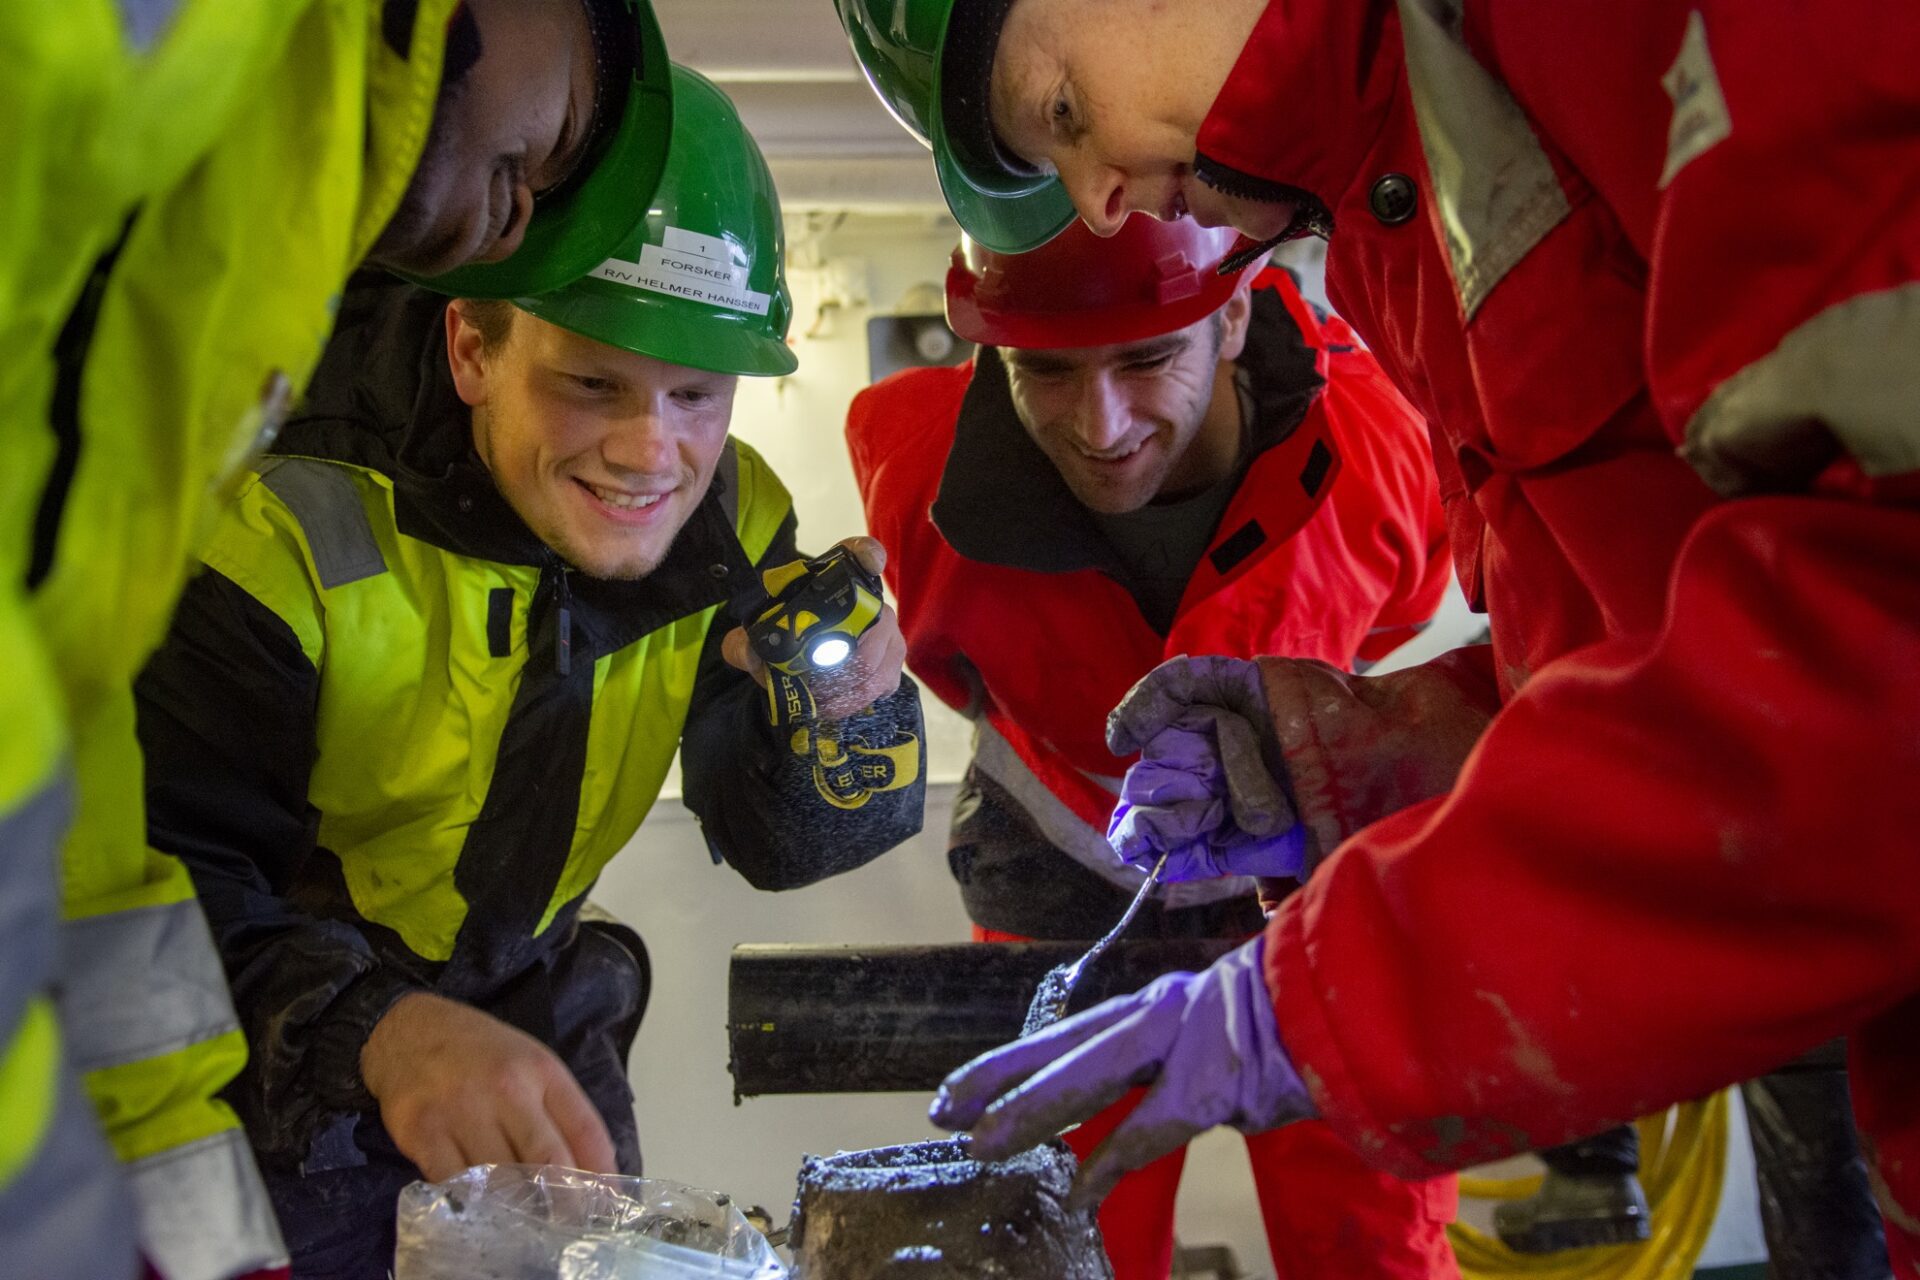
    A fun moment during the working on the just acquired core.

    Here are some personal impressions from cruise CAGE21-4 to the central Barents Sea. Let’s start with the negatives. Unless this cruise was sponsored by a known milk brand, there is no excuse UiT cannot provide decent quality drinking water to its employees. A few of those big water jugs can only be beneficial for future cruises on R/V Helmer Hanssen.

    Sediment for headspace gas analysis is sampled from the freshly exposed base of a core section.

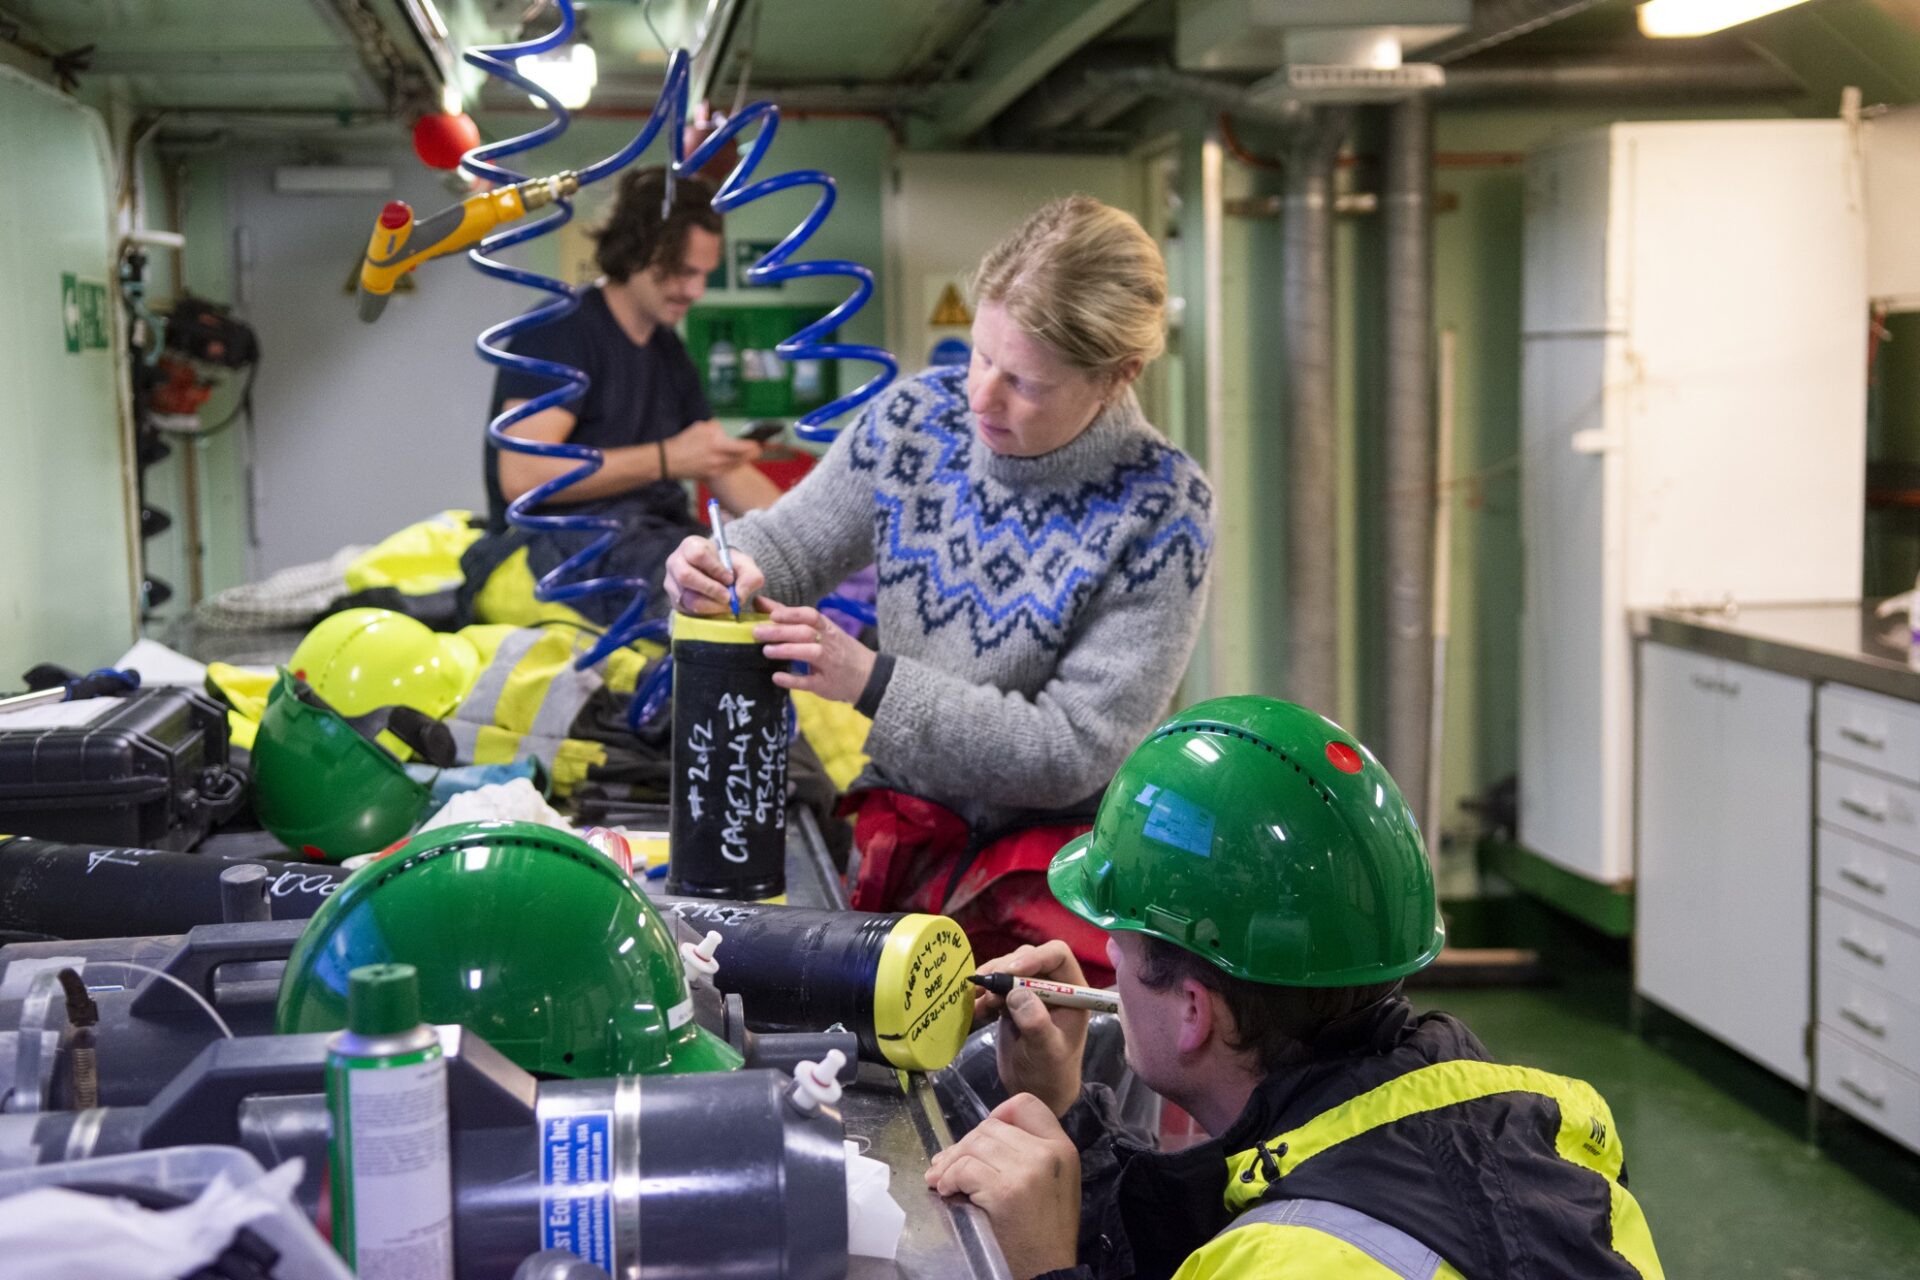
    Apart from that, what a valuable experience it has been. I enjoyed the hands-on working, for instance when collecting sediment samples for headspace gas analysis, which I had never done before. I am also glad for the practice gained at multibeam water column image interpretation while picking gas flares (altogether we identified over ten thousand flares).

    Henry brings a core section into the lab.

    Preparation of the core for storage.

    This cruise has been filled with many moments of awe. On one occasion, I was drawing porewater into vials containing mercury chloride (the most toxic chemical I have ever used), and saw them turning each a different shade of yellow, reflecting increasing sulphide concentration downcore. Sulphide is a product of the aerobic oxidation of methane in the sediments, so just by looking at the colour of the vials one can infer that there is a strong methane flux in that environment.

    Porewater is collected from cores using rhizon samplers, polymer tubes inserted into the sediment and fitted to low-pressurised syringes.

    Mercury chloride is an extremely toxic chemical, and we add it to stop microbial activity in porewater samples. Incidentally, it reacts with sulphide ions forming mercury sulphide, a solid precipitation of yellow colour. The darker the yellow, the higher concentration of sulphide.

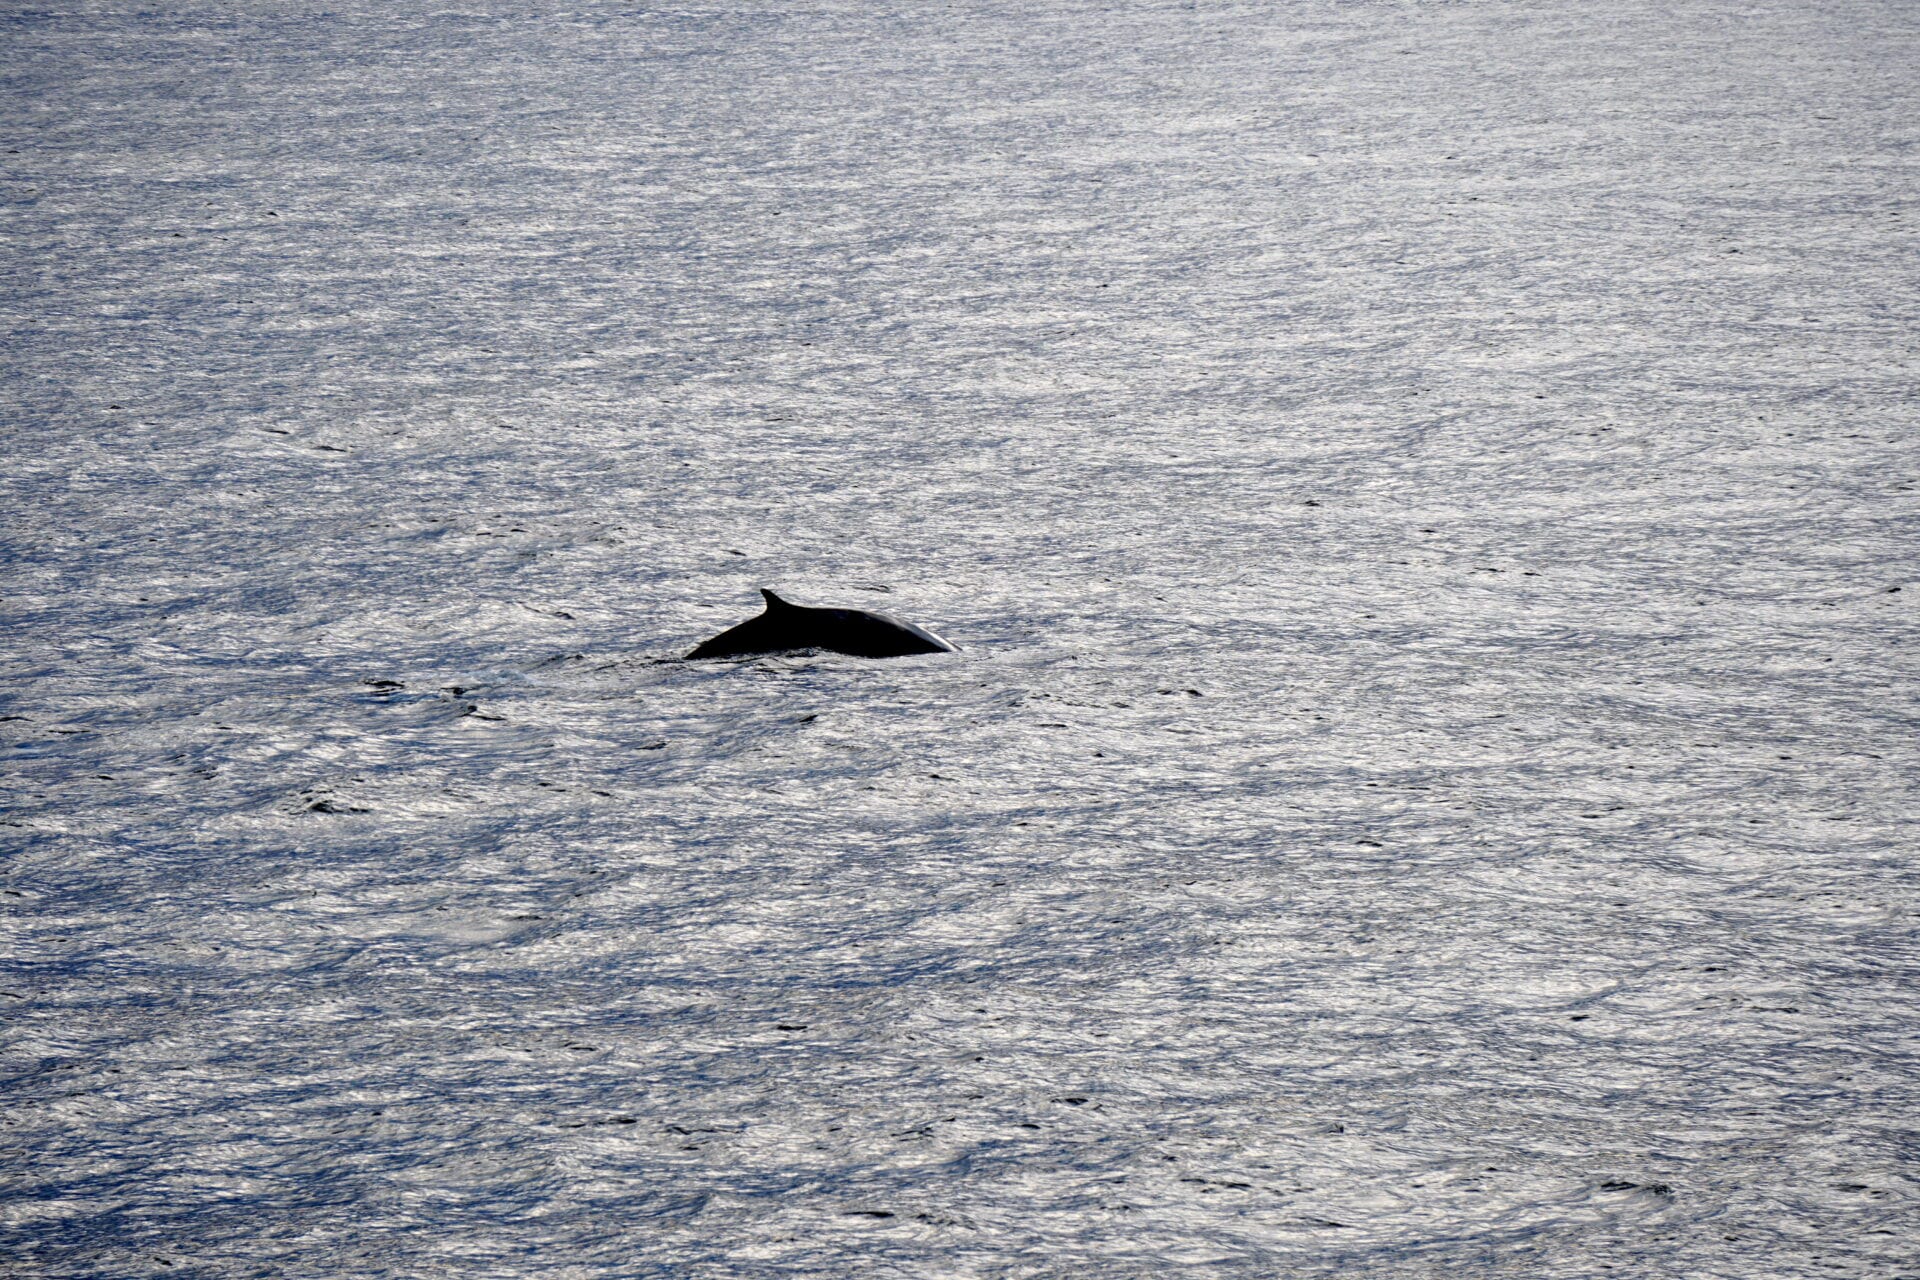
    We spotted several whales and dolphins along our way. One memorable scene was when an oil sampling trip on the dinghy boat turned into a whale safari. A finback whale at least three times the size of the boat materialised out of the blue. We were struck by her sound; the photo does not do justice to how amazing it was to be there.

    A finback whale pays us a visit and inquires about our research.


    Fishcakes and porridge for breakfast has been yet another experience, most likely a unique one, though I’m glad I can now brag about it.

  • Shifting focus to a glaciological perspective

    Shifting focus to a glaciological perspective

    Text and photos: Henry Patton


    Our final 24 hours of this research expedition will shift focus from hydrocarbon-based aspects to a more glaciological perspective. This also means a transit to a new area, to the nearby glacial trough of Sentralbankrenna, which around 15,000 years ago hosted one of the last major outlet glaciers of the retreating Barents Sea ice sheet. As the Earth thawed at the end of the last ice age, rising air and ocean temperatures triggered the collapse of the once 3-km thick ice sheet that covered most of the Barents Sea and NW Europe. Sentralbankrenna was one of the last areas to deglaciate due its location in the central Barents Sea, and so the geological information left behind here can tell us much about the processes of why and how such large marine-terminating glaciers can disappear under times of rapid climate change.

    I visited this area previously in 2020, where we managed to collect some multibeam echosounder data showing some tantalising snapshots of the glacial deposits and landforms left behind on the sea surface. Our plan is to supplement this data and fill in some of the many gaps still left behind – yet with limited time on our side and Sentralbankrenna being a very large trough some 100 km wide, our decision for where to survey becomes remarkably difficult.


    Figure 1: Multibeam echosounder (MBES) data tells us what the seafloor looks like in high resolution. In Sentralbankrenna our swath – our window of the seafloor – is c. 1 km wide. Source: Wikipedia.


    After some debate on the best strategy we decide to focus on two areas, one over what appears on low resolution data to be an interesting complex of hummocky topography where a glacier may have once terminated, and the other over what could be a subglacial channel where water may have flowed below the ice sheet. Clues published from elsewhere in this region indicate that abundant meltwater reaching beneath the glacial ice was a key characteristic of these systems as they collapsed.


    Figure 2: Where to survey? Relatively low-resolution imagery of the seafloor (IBCAO) provides tantalising clues of the glacial deposits present. This area in the southern part of the trough is c. 120 km wide, giving a clue as to the scale of the glacial ice that used to exist here.

    Then, disaster strikes! With data streaming in, the captain suddenly informs us he needs to stop the ship immediately – there’s some trouble with the engine. The ship’s engineers soon report back that they need to replace a part and change some 4,000 litres of oil. It won’t be a quick job but it seems at least we won’t be stranded in the middle of the ocean for long. After some hours the engine restarts and with some relief we can resume sailing, with our bearing now firmly fixed on a return back to Tromsø.

    Although the data collection was abruptly cut short, what we found showed some very interesting information, and as usual its interpretation raises even more questions on what happened here thousands of years ago. This certainly won’t be our last visit here.

    Figure 3: Sailing back to Tromsø with a fixed engine. The colour of the sea is remarkably turquoise, an indication of the abundant phytoplankton blooming in the area.

  • A drop in the ocean

    A drop in the ocean

    Text and photos: Frank W. Jakobsen (PhD at CAGE) and André Jensen (NPD)

    It has been reported about potential seepage of oil to the sea surface in various locations in the central Barents Sea. The potential oil is believed to originate from natural sources in the area and has been observed from both satellite images and scientific cruises. A part of this cruise aims to sample these sights to verify their origin and whether it’s oil. If it is oil, then taking these samples and analyzing them can help us to understand the source of the oil, its composition, and the geology better.

    Everything you need to sample oil from the surface.

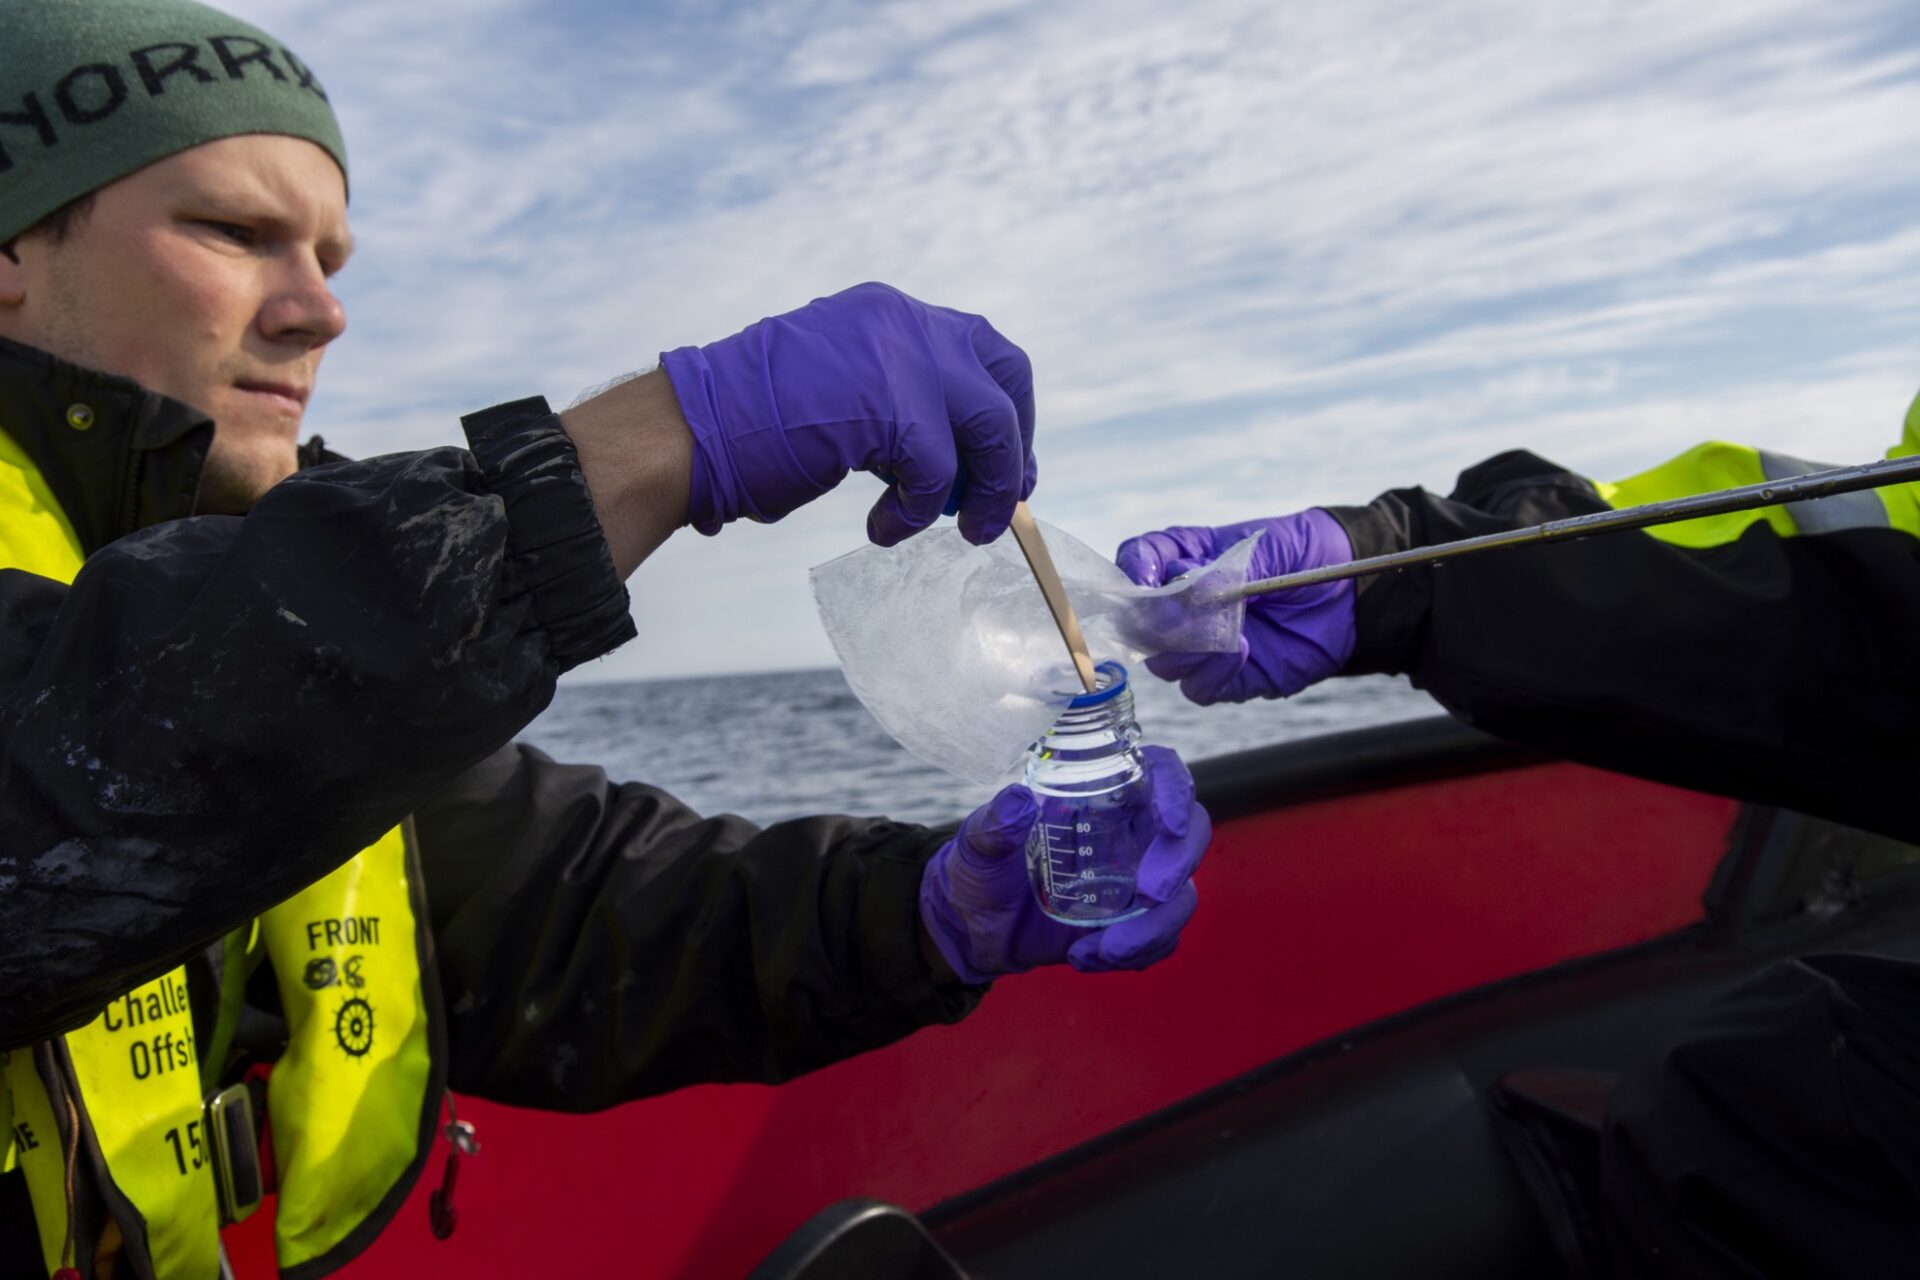
    For this purpose, André Jensen (NPD) had brought a black box containing something that looks like a selfie stick, a little cloth, wooden sticks, and a glass bottle with screw cap. At first sight, not very high-tech stuff. However, the cloth is made of a highly sensitive and extremely clean membrane that will absorb any oil on the water surface, or any other surface for that matter. The cloth is simply put on the stick and waved around in the water surface where we can see oil slicks. After a few minutes of this, the cloth is safely put into the glass bottle using the wooden stick, and stored cooled until it can be analyzed in the lab.

    André ready with a cloth attached to the stick. Looking for fresh oil slick to appear. The oil slicks are here seen as lighter patches partly drawn out by currents/wind. A fresh, round oil slick can be seen in the lower right corner.

    André samples a fresh oil slick as it came up to the surface. Other drawn-out oil slicks can also be seen in this picture.

    In collaboration with NPD and CIRFA we are looking for oil slicks guided by satellite images and watch duties on the bridge. After a few days of bad weather and poor conditions we finally found oil slicks on the surface! It’s fascinating to see small droplets of oil disperse as it come up to the sea surface, knowing it comes from a source deep down, potentially buried for hundreds of millions of years, all to become another colorful drop in the ocean.

    Frank puts the cloth with oil samples in a glass bottles using a wooden stick.

  • Reflections of a project leader and co-chief scientist for the AKMA cruise

    Reflections of a project leader and co-chief scientist for the AKMA cruise

    I had never really thought about writing a blog before, but as I am on-board of a near-ending cruise and am in the middle of writing a report for summarizing this cruise, I realize how much this cruise has been valuable under many prospects, not only as a scientist and a teacher, but also as a person. So, I decided to write this blog, and explain to you all the many great experiences, emotions and feelings that this cruise brought me.

    Text and photos: Giuliana Panieri, AKMA project leader and co-chief scientist of the AKMA cruise.

    June 2021

    The AKMA project had a rough start, it was granted by the Norwegian Research Council at the beginning of 2019, and with the partners (WHOI, Woods Hole Oceanographic Institution) we began discussing and planning the course and the cruise we wanted to develop for the students. Our ultimate goal was to develop a course that would focus on a multitude of aspects related to methane in the Arctic. Little did we know that our newborn project would be completely halted by a global pandemic. We all remember March 2020, and one thing I clearly remember was in fact one of the first meetings we were having to plan this cruise. All of a sudden, all of the participants of the meeting (which were all gathered in an actual physical room with walls at the time, not a virtual room like on Zoom) were basically kicked out of the department because everything was starting to close down.

    Cruise planning meetings.

    This is why I say that the project had a rough start, but this rough start gave it tough skin and resilience. Although this pandemic made us distance ourselves from each other, I believe that it also brought people closer. I started thinking about ways in which, with our science, we could touch a broad audience to inspire and share knowledge in these times of darkness and uncertainty. From colleagues and scientists to adolescents. So, me and the team had to think differently than usual, we had to think creatively and diversely because we would not give up and we accepted the challenge. These challenges had to be transformed into solutions and we came up with ideas that were developed through a Polaroid project, a virtual cruise, a short video to inform people about our work and we established social media platforms for our project. And finally, during May and June of 2021 we were given the green flag to have our AKMA expedition in the Arctic Ocean and in the Barents Sea.

    Andy Bowen giving a seminar from WHOI for the students on board of KPH.

    We involved all the colleagues that could not join from the U.S., hosting them every evening on Zoom calls, we shared our discoveries and daily experience on social media and on video calls, which we had with our younger audience from all over Europe. I am not going lie, I was quite skeptical about the social media aspect of the project, until one of my colleagues told me something beautiful: “for the first time my family sees what I am doing at sea looking at the live video feed from the ROV, and they are asking questions… this is the first time they really understand what my work is”. Our jobs are not easy, and what we do is not simple to explain. But via social media we were finally able to truly show everyone back home what it is that we really do on our cold days in the middle of the Arctic Ocean miles and miles away from land.

    Although this is a big part of my job, I can tell you that being at sea is not always easy… Seasickness and being homesick become your best friends, but this time, my best friends changed. I was thrilled by the enthusiasm and curiosity of the students, their drive to learn and their thousands of questions made it such a remarkable experience! This happiness of mine was not only limited to the students, but equally to the professional and friendly behaviors of my colleagues on-board, the availability from the colleagues ashore, the support from my university and the many EGU friends and volunteers, and lastly the crew: all those women and men that spend their days at sea, navigating in the waters of the unknown, science and knowledge always seeking, imagining and with an open mind, always learning.

    AKMA cruise Participants.


    Read more about the AKMA Project here and the 2021 cruise blogs here.

  • Using various sampling procedures to investigate the flares

    Using various sampling procedures to investigate the flares

    Text and photos: Mauro Pau, Postdoc on Hopendjupet  CAGE21-4 cruise

    August 6-7th, 2021.

    Yesterday’s multibeam echosounder survey reveals that the seepage sites are not regularly distributed across the area, suggesting a strong geological control. Existing seismic lines show that an anticline structure may facilitate the escape of hydrocarbons from their reservoir. In order to get a more detailed picture and visualise the shallower subsurface structures, we navigate along those same lines with our chirp sub-bottom profiler switched on.

    Recovering the CTD rosette.

    This new data further allows us to identify sites with a sufficiently thick sediment cover to collect gravity cores. We select a number of sampling stations, both with evident seepage and virtually seepage-free as a control. Where the sediment cover is poor, we opt for box coring, which still provides plenty of material to be analysed. The analyses will include composition of the headspace gas, or interstitial gas in the sediments, as well as the pore water.

    Ship’s engineer Stormer Jensen (left), CAGE researcher Henry Patton, CAGE’s new PhD student Frank Jakobsen, and IG master’s student Abidemi Akinselure await for a gravity core to be brought on deck.

    At each station we also perform CTD casts to measure water mass properties and sample the water column. This data will contribute to tracking down the hydrocarbon source. One further task we aim to accomplish is to sample the oil on the sea surface, so we head towards the slicks observed in the latest satellite images. Our colleague from NPD has the right tools for the purpose, a special membrane to scoop the sea surface and a stick.

    André Jensen (NPD) handles over a water sample from the CTD rosette.

    Cruise leader Monica Winsborrow (left) discussing with Stormer and Henry.

    Finally, before leaving the area and moving further north, we survey an additional 130 square kilometers of seabed with the multibeam echosounder, imaging several more seepage sites.

    Henry Patton (left) and our NPD’s colleague André Jensen transfer on board the dinghy boat to attempt sampling an oil slick on the sea surface.

  • Investigating the forest of flares

    Investigating the forest of flares

    Text and photos: Mauro Pau, Postdoc on Hopendjupet  CAGE21-4 cruise

    August 5th, 2021.

    We are in an area of the central Barents Sea not (yet?) reached by the oil industry, but where oil slicks have consistently been identified on the sea surface from satellite images. The escape of oil through the seabed is a known natural phenomenon, and is controlled by climate and geological factors. Improving knowledge on how geological structures and seabed morphology affect hydrocarbon release here in Hopendjupet may be beneficial to better understand how some areas are more vulnerable than others to global climate warming.

    André Jensen (NPD), cruise leader Monica Winsborrow and master’s student Abidemi Akinselure.


    A team of CAGE scientists who visited the area a year ago reported a surprisingly high methane seepage activity. Our first priority is to have a more extensive picture of where the seepage occurs. We do so by complementing the previous sparse, but revealing, multibeam echosounder lines with the homogeneous survey of a rectangular area of over 400 square kilometres (or around 20 times the size of Tromsøya, for the connoisseurs).

    Ship’s engineer Truls Holm.


    Water depths range between 280 and 330 m, and a beautiful meltwater channel system appears below us, carved under the ice sheet that once covered the entire Barents shelf. Importantly, the multibeam data of the water column shows where the gas seeps are. Although we knew we would have found several, we remain equally amazed at the amount of seeps we encounter, in the thousands, and at the magnitude of many of them. Some may well reach the sea surface, possibly delivering methane to the atmosphere. Oil may travel upwards in the water column as a film covering the gas bubbles.

  • The decision is made: we will sail to the central Barents Sea

    The decision is made: we will sail to the central Barents Sea

    We are heading to an area of exceptionally intense seafloor methane leakage, associated with sea surface oil slicks, first studied during a CAGE cruise last year. We plan to acquire new datasets to help us understand why so much methane is leaking from this area, and if this powerful greenhouse gas is reaching the sea surface and atmosphere.

    Text: Monica Winsborrow, cruise leader for Hopendjupet  CAGE21-4 cruise

    August 4th, 2021.

    We are grateful to be able to run cruises during these Covid times. But doing so requires us to be flexible and adaptable with our plans.

    This is however my first cruise where we have arrived on board not yet knowing where we will go.

    We arrived in Longyearbyen to board Helmer Hanssen with plans for two cruises prepared: (1) NE Greenland continental shelf, hunting for clues about how the Greenland Ice Sheet has behaved here in the past and how this may have influenced the release of carbon, stored beneath the seafloor and (2) an area of exceptionally intense gas seepage in the central Barents Sea, identified during a CAGE cruise last year.

    University regulations due to Covid mean that we are restricted to how far we can sail from Tromsø, and this depends on weather and sea-ice conditions.

    So, after looking at the sea-ice maps with the captain, it was decided that there was too much ice to allow us to go to Greenland. So, the decision was made. We set sail for the central Barents Sea.

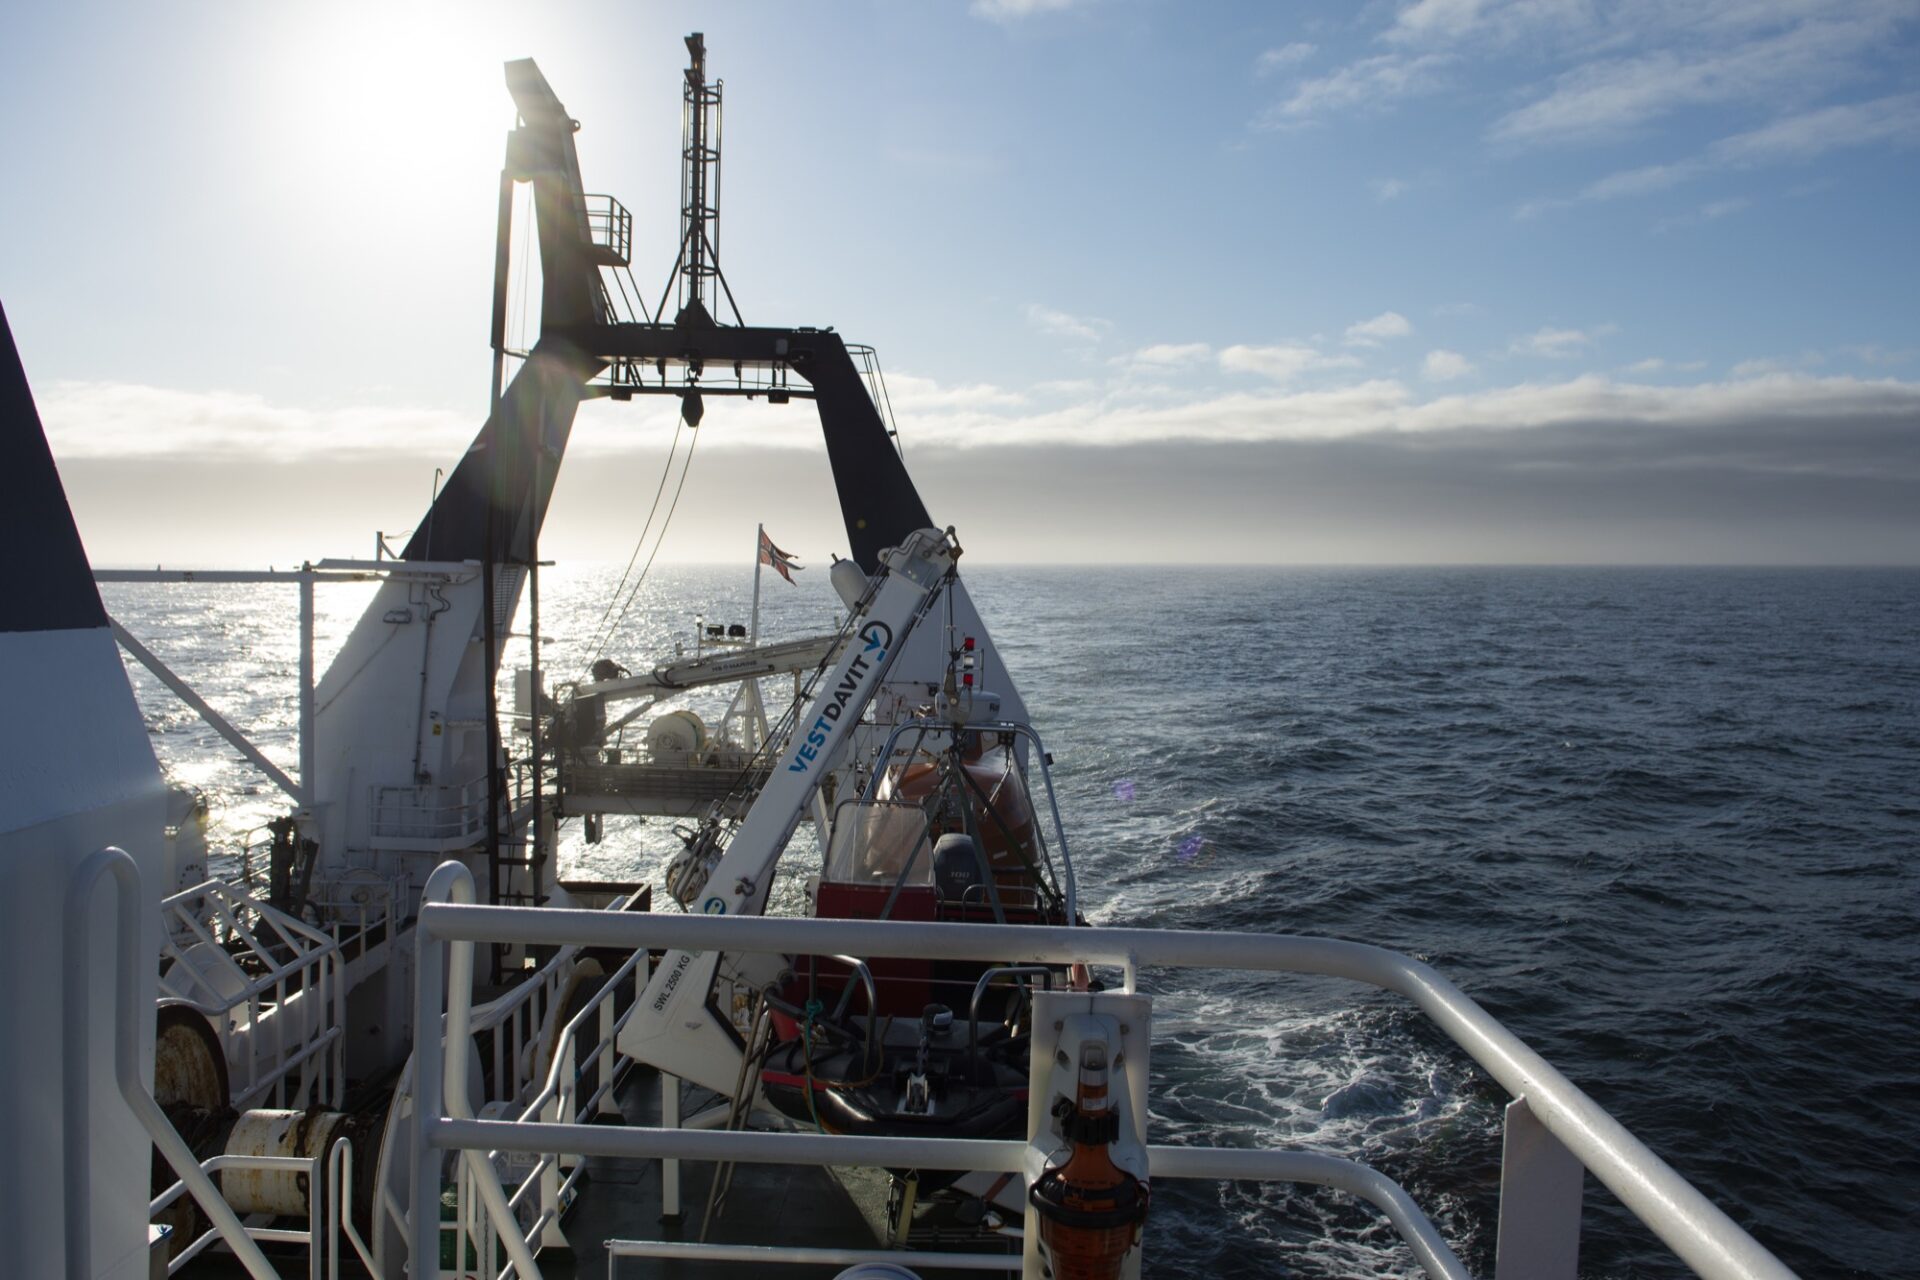
    Heading to the Barents Sea (Photo: Mauro Pau)

    We are now on our way to the main study area accompanied by calm seas, sunshine and whales. Once we arrive our priorities will be identifying and mapping of seafloor methane release sites and then tracking the path of this powerful greenhouse gas from the subsurface sediments, through the water column and potentially to the atmosphere.

    Onboard we are a team of scientists from CAGE and a colleague from the Norwegian Petroleum Directorate, ably supported by engineers Stormer and Truls.

    Henry Patton looking for flares in the instrument room (Photo: Mauro Pau)

  • Fog, winds, waves and WHALES – our jokers

    Fog, winds, waves and WHALES – our jokers

    There is not only the weather variable when we work with geophysics off the Svalbard Archipelago…Fog, winds, waves and whales were our jokers in this expedition.

    Text: Frances Cooke.

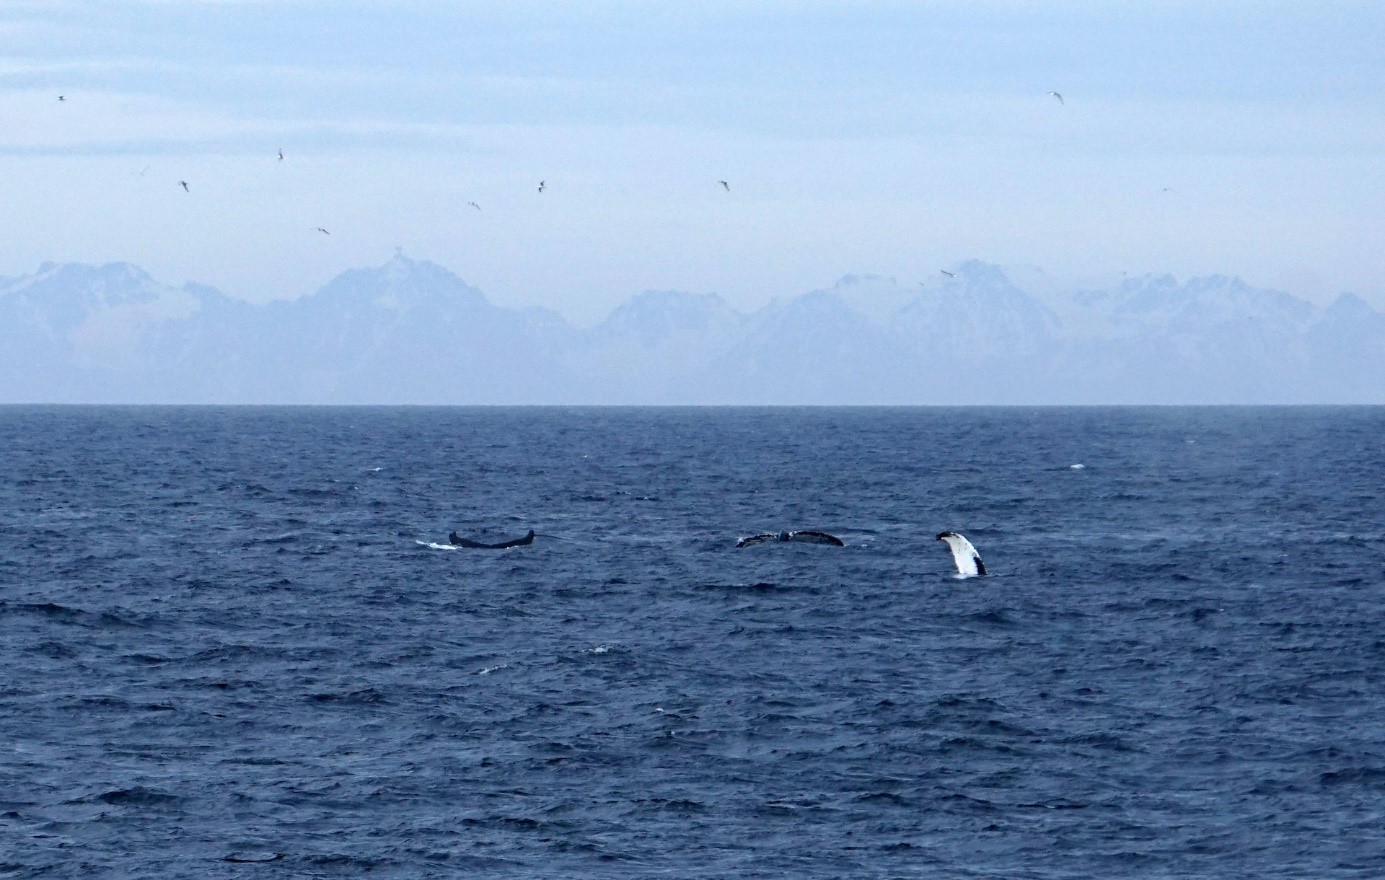
    To recover the ocean bottom seismometers (OBSs) from the ocean floor we need to have good visibility and no waves. The waves are in turn depend on win (to some extent). When we finally got a window with slow winds and no waves, we got the fog to set in for long hours. When all the rest was suitable for recovery we got the whales to dance and captivate us.
    It has been a great learning experience with lots of training on how to observe, hear and sense our surrounding when we are out in the wild open ocean.
    The pictures below give a taste of captivating moments we had during our work with the OBSs this time. Now we are heading slowly home. I look forward to my boys and to share with them some nice stories about the Sea.

    A party of Finnhval (Finwhales) and Knølhval (horn whale) started, we stopped all the acoustics, contemplated and left (Photo: Vera Schlindwein)


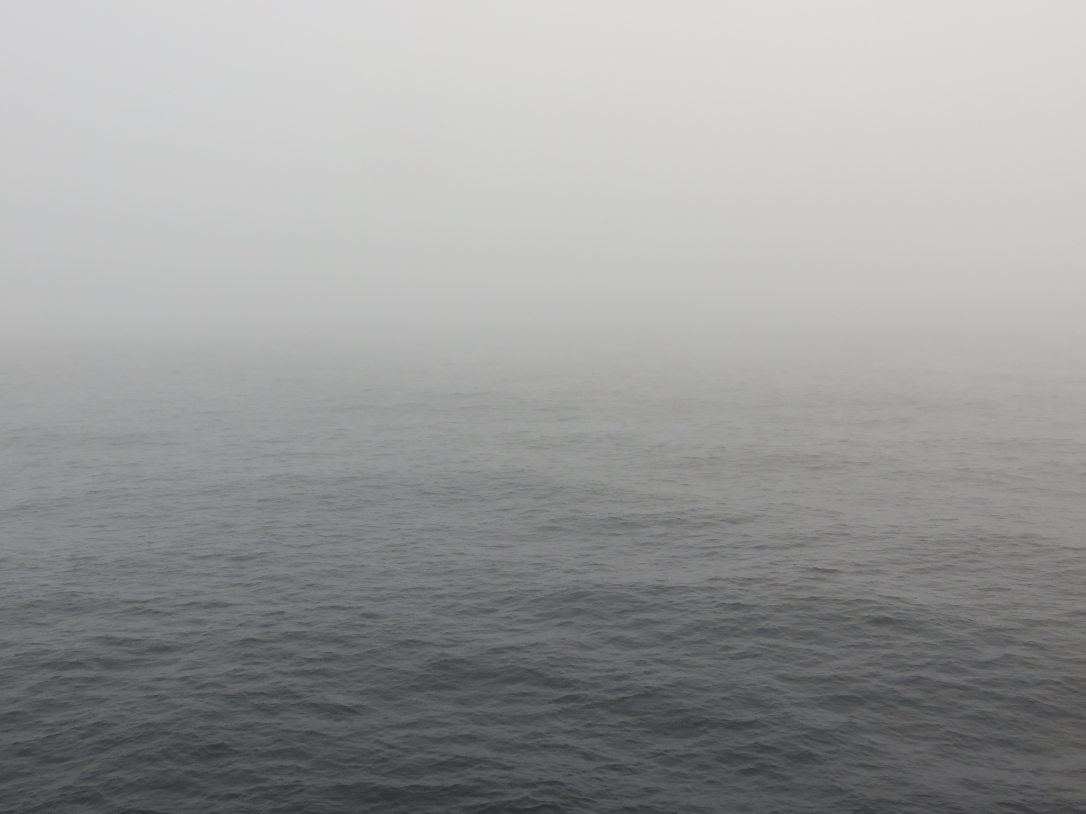
    Just the fog, the calm sea, the nothing… (Photo: Frances Cooke)


    Read more about the SEAMSTRESS project here.

  • Transit back to Tromsø

    Transit back to Tromsø

    Cruise Blog by Frances Cooke: Day 12

    July 18th, 2021

    Text and photo: Frances Cooke (PhD Candidate in the Gas Hydrates and Free Gas Reservoirs research group at CAGE, working within the SEAMSTRESS project).

    This morning we successfully recovered the last two OBS. It was a relief to have them all back onboard! Shortly afterwards, we left Knipovich ridge and started our two day journey back to Tromsø. On the way, we will stop at a study site called Bellsund, we presume named after Bellsund fjord, situated on the west coast of Svalbard. The site is actually much further south from Bellsund. It is opposite the Hornsund fjord. Here we will shoot two final seismic lines for our Italian colleagues.

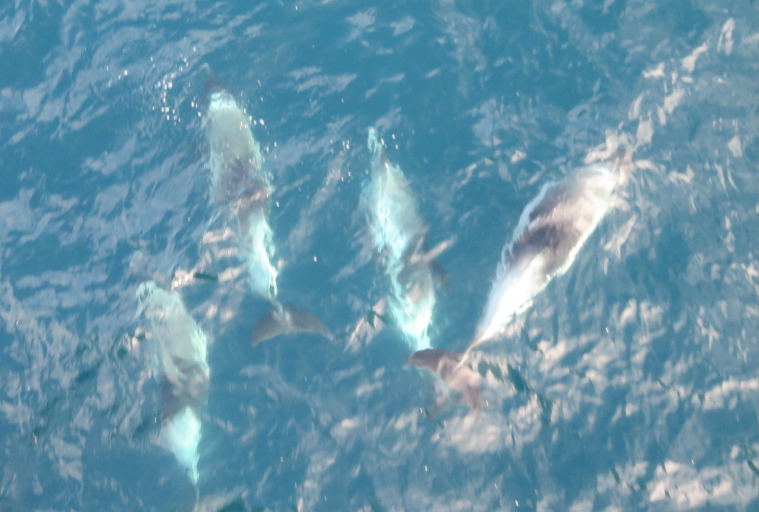
    After half an hour in the fresh sea air, watching the birds flying around the ship, I spotted a feeding frenzy. From a distance, it looks like the water is bubbling. Dolphins surface, one after the other, and dive back down into the water. The birds hover above, waiting for the scraps. After their feed, the dolphins could not resist coming towards the ship to play in the waves beneath the bow.

    Dolphins playing beneath the bow of the ship


    Read more about the SEAMSTRESS project here.

  • Waiting for calm weather windows

    Waiting for calm weather windows

    Cruise Blog by Frances Cooke: Day 11

    July 17th, 2021

    Text and photo: Frances Cooke (PhD Candidate in the Gas Hydrates and Free Gas Reservoirs research group at CAGE, working within the SEAMSTRESS project).

    We completed two seismic lines, at Svyatogor ridge in the night and there were no whales in sight. The wind speed was low for the first line and had gradually picked up by the start of the second line. We then recovered the guns and streamer just before breakfast, before heading back to our NKR active seismic site. During the first half of the day, the winds reached up to 18 m/s, which was far too much to redeploy the seismic at NKR, so we waited. There was no whale watching.

    When the winds had dropped down to 11m/s, we decided to deploy the seismic and finally finish what we had started two days ago! We are nervously waiting for calm weather windows to appear so that we can get back the OBS. The OBS each have a programmed automatic release time, which is 16:00 tomorrow.

    The wind dropped to a gentle breeze, and we swiftly recovered three out of the five OBS. The remaining two OBS from UiT are more difficult to see, and the fog had started to set in. We decided to leave them until the morning.

    We shot our final seismic line after taking the break to recover the OBS, and after dinner, planned a water column survey over the NKR active seismic study area. Microbial mats discovered on the seafloor, during a previous cruise, suggest the release of methane gas and we might expect bubbles escaping from beneath the water bottom.


    Fog and stillness


    Read more about the SEAMSTRESS project here.

  • Whales as far as the eye can see

    Whales as far as the eye can see

    Cruise Blog by Frances Cooke: Day 10

    July 16th, 2021

    Text: Frances Cooke (PhD Candidate in the Gas Hydrates and Free Gas Reservoirs research group at CAGE, working within the SEAMSTRESS project).


    We continued shooting seismic for the active survey experiment. Some inlines were dropped, to make up time so that we would be ready by 16:00 to start the circular lines. The weather conditions remain perfect for seismic, the sea is calm and there is a moderate breeze.

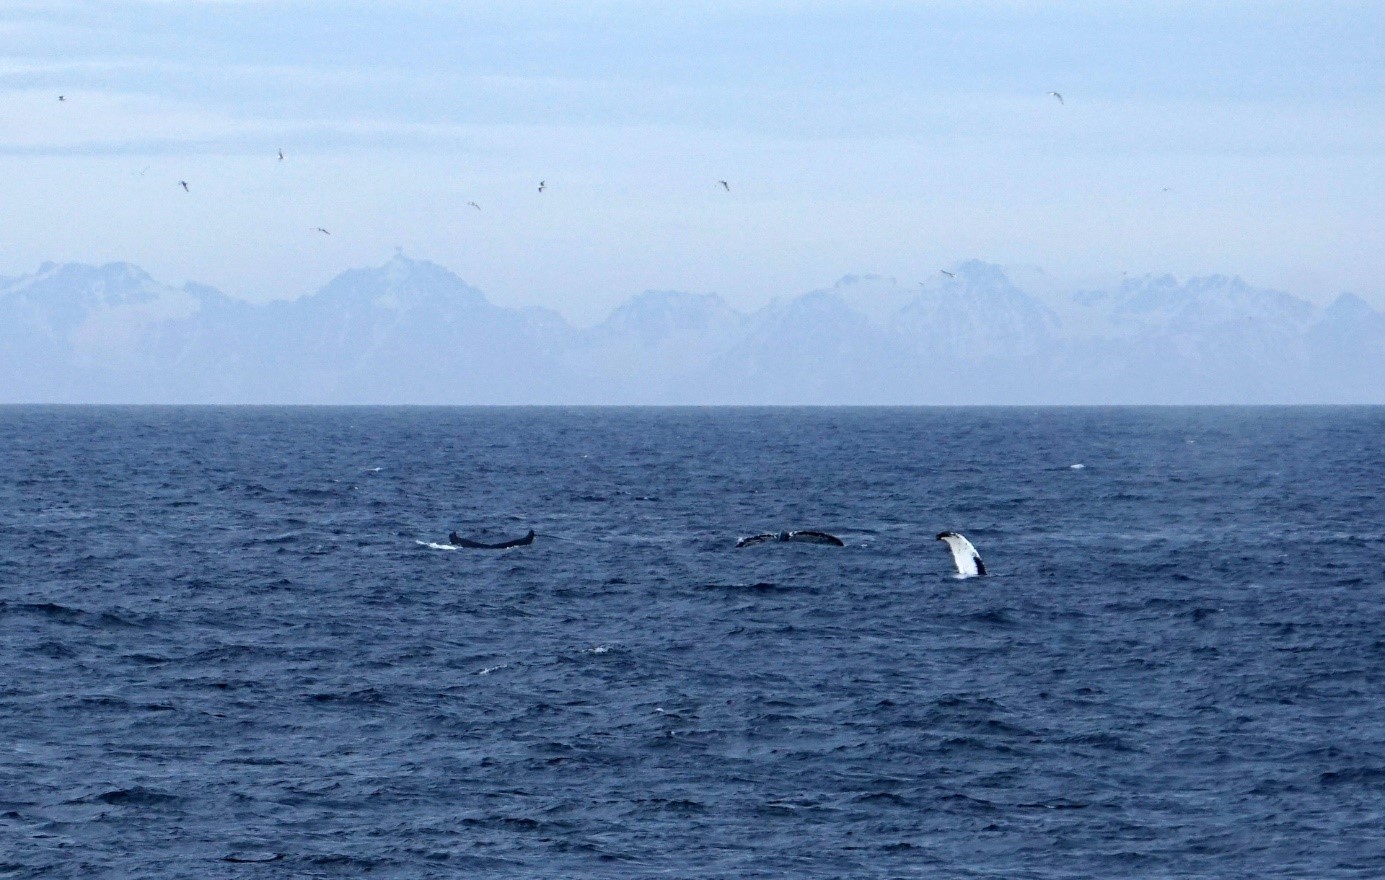
    One thing is certain while working at sea; you can never be too confident that things will go to plan! We had planned to recover the OBS tomorrow morning after completion of the seismic lines, however a large number of whales showed up within 500m of the ship. As there were so many whales showing up so close to the vessel, we shut down all our acoustic systems, including the seismic guns. On the bridge they saw plenty of finwhales and Knølhval (horn whale) breaching the surface. The ‘Havforskningsinstitutet’ (Institue for marine research) specify that the Greenland whale and Narwals are species that require the most protection.

    The mini GI air guns we use for the seismic are 15 and 30 cu.in. The guns are significantly smaller than conventional seismic guns used in industry. Higher powered guns are used to send signals much deeper into the subsurface. We are only interested in high detail in the near surface sediments (top ~300m).

    While on the bridge deck looking out in awe, we spoke about how long we should wait before starting the seismic back up. This depends on the water depth. Whales spend up to 45 minutes beneath the surface in deep (+1000m) water, so we could be waiting an hour before knowing whether the whales are still close by. I worked on a seismic vessel where we had a marine mammal observer onboard. However, she would not observe the whales. Instead, with her own hydrophone, would spend the whole shift with headphones on, listening for whale calls. Relaxing shift?

    As time is precious, we decided to move away from the active seismic survey site and move south to Svyatogor ridge to complete some seismic lines for our colleagues not on the cruise – in whale free areas.

    Whales as far as the eye can see. (photo: Vera Schlindwein)


    Read more about the SEAMSTRESS project here.

  • Arrived to new survey site

    Arrived to new survey site

    Cruise Blog by Frances Cooke: Day 9

    July 15th, 2021

    Text and photos: Frances Cooke (PhD Candidate in the Gas Hydrates and Free Gas Reservoirs research group at CAGE, working within the SEAMSTRESS project).

    We arrived to our new active seismic survey location yesterday late afternoon and started with chirp survey lines closely spaced over a previously interpreted mud diapir and buried glacial meltwater flow. The chirp is also seismic data and classed as ‘single channel.’ It uses a hydrophone array mounted on the hull of the ship, and the transmitted sound is just a ‘ping’ or ‘chirp,’ as opposed to ‘multi-channel’ hydrophones along a seismic streamer, that require a small ‘bang’ from the guns. The frequency is much higher; therefore, with this system we are able to image even finer (decimeter scale) sediment layering near the surface. The chirp typically penetrates ~40 m into the sediment in this area, however the chirp system on this ship penetrates just < 20 m, so we are missing some data deeper down.

    3D surface in miliseconds two-way time, using a rainbow colour scale, extracted from 3D seismic volume data, shows a buried glacial feature. The purple line is one of the chirp survey lines that passes south of the feature. At the east of the line, we observe some hard glacial material transported by ice during the last glacial period.

    The profile of chirp line 3 shows the buried glacial debris – a hard surface, potentially supersaturated with water or gas.


    This morning 5 OBS were deployed for the active experiment. Two belong to UiT and have a short period frequency range for detecting shallow earthquakes and the remaining three are broadband OBS from AWI that also have long period signals that range deeper.  The OBS team had a rocky start deploying the instruments, with the first OBS bashing into the side of the ship, and needed some repairs.

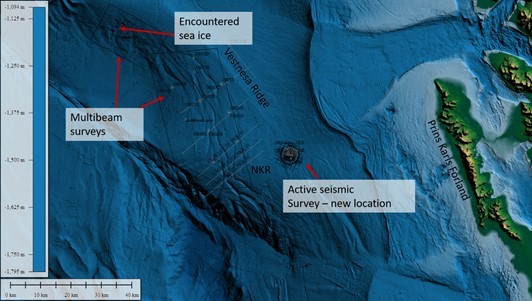
    Bathymetry map (topography of the seafloor) showing an overview of the work completed in the cruise so far and our ongoing active seismic survey, in the new east location, with Prins Karls Forland in site.


    After completing the chirp survey lines and deploying the OBS, we put out the seismic today at 12.15. We will shoot all 12 crosslines and some ‘inlines’ first, then we will move onto the circlular lines. The acquisition survey design is typically in this way for OBS active experiments, with the feature of interest in the centre of the array. The placement of the OBS is also dependent on the topography of the seafloor. We try to avoid landing them on dipping surfaces and away from depressions. We have begun with the crosslines (NE-SW), and by tomorrow we should have come to the end of the in lines (NW-SE).  The wind has finally dropped and the sea is calm – for now!


    Active OBS experiment seismic array (black lines) and chirp survey lines in gray.


    Read more about the SEAMSTRESS project here.

  • Working around the sea ice

    Working around the sea ice

    Cruise Blog by Frances Cooke: Day 8

    July 14th, 2021

    Text and photo: Frances Cooke (PhD Candidate in the Gas Hydrates and Free Gas Reservoirs research group at CAGE, working within the SEAMSTRESS project).

    The fog cleared during the night while the OBS team were in bed, and the sun shone briefly. We continued the multibeam survey, started two days ago, all through the night, until breakfast. We had an English breakfast this morning, eggs and bacon, but no beans. The final OBS was recovered mid-morning and OBS preparation for the active seismic experiment has started.

    If it’s not the strong wind or the fog preventing OBS work – it’s the sea ice! We planned a seismic experiment before the start of the cruise, in the west of Vestnesa ridge. Here we will most likely encounter sea ice. We discover today that our proposed location for the OBS sits within the open drift ice. It would be foolish to take the risk and deploy the OBS, while the charts show drift ice nearby. I am told that deploying the OBS in sea ice is no problem, but when the OBS surfaces it could get stuck beneath the ice.

    The  Norwegian Meteorological Institute (www.cryo.met.no) provides ice charts and satellite images daily that we can use to monitor the whereabouts and movement of sea ice. The satellite imagery is not affected by cloud cover and can acquire data during the day or night and under all weather conditions.

    An ice chart overlaid onto the bathymetry (seafloor map) provides location of drift ice in the Fram Strait. The active seismic planned experiment in the west of Vestnesa ridge is within open ice drift.

    The latest satellite image used for mapping of the sea ice (cryo.met.no). The sentinel-1 mission includes a C-band Synthetic Aperture Radar (SAR) sensor that has a resolution down to 5m. Red arrow points to west Vestnesa ridge.

    The winds were high in the afternoon, so we continued with multibeam mapping, extending away from our first survey area towards the northwest. Once the ship met the sea ice we decided to abort the multibeam survey, change course and head three hours east to prepare ourselves for the active OBS deployment in an ice free conditions.


    For the transit there were fresh wienebrød (Norwegian custard centered pastries). De var gode!


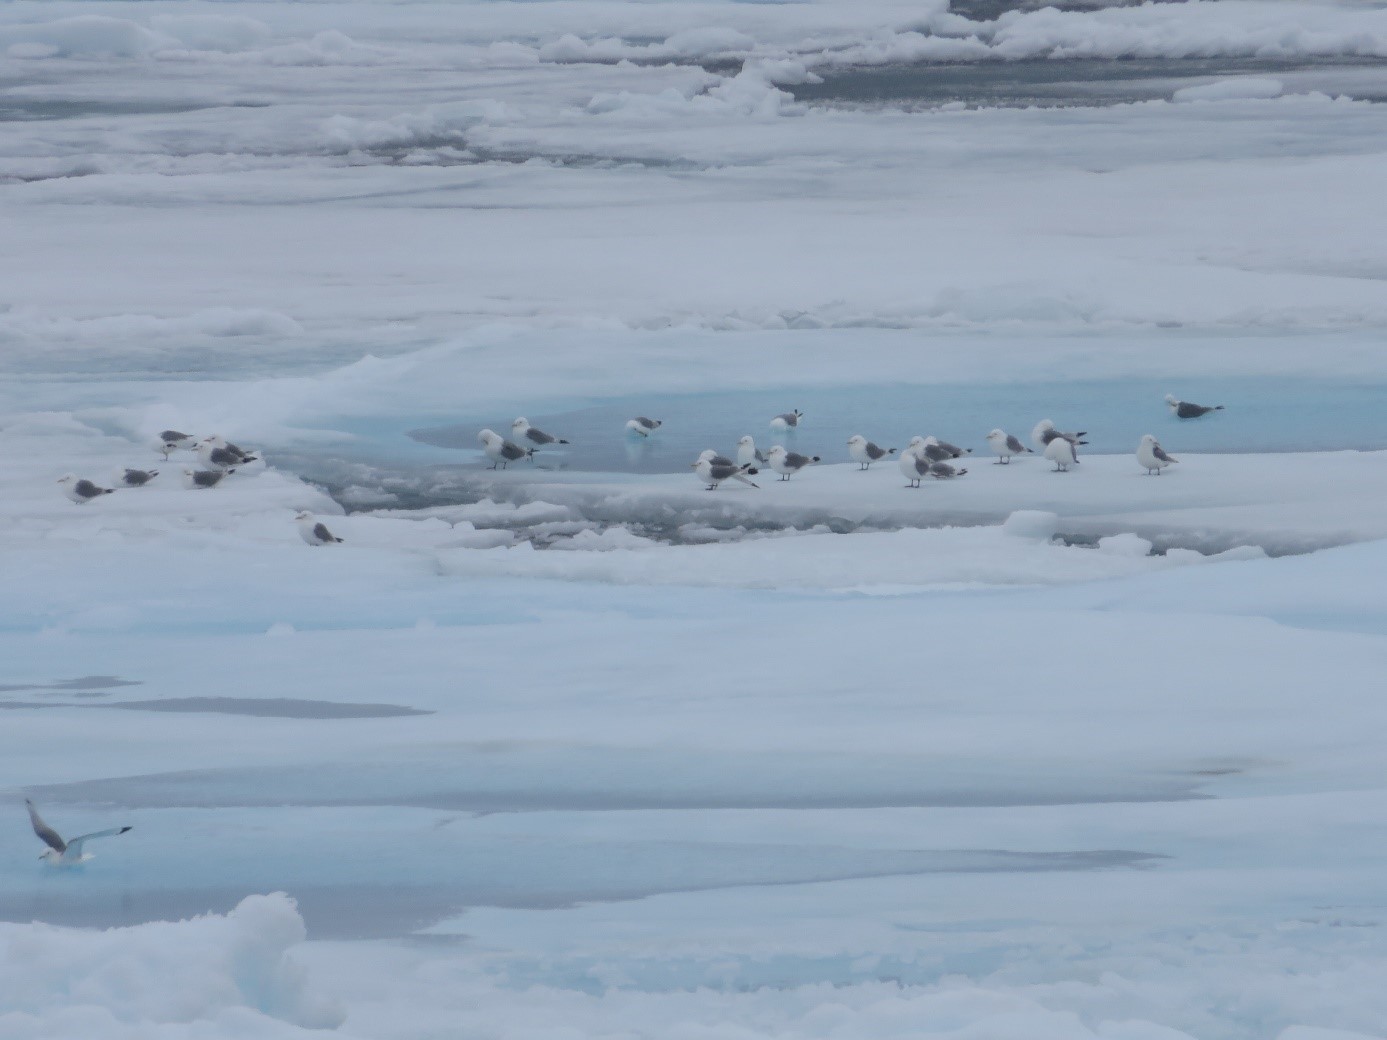
    Birds pictured on the sea ice, during the last multibeam survey line, heading northwest, towards the western part of Vestnesa ridge.


    Read more about the SEAMSTRESS project here.

  • Poor visibility and successful OBS recoveries

    Poor visibility and successful OBS recoveries

    Cruise Blog by Frances Cooke: Day 7

    July 13th, 2021

    Text and photo: Frances Cooke (PhD Candidate in the Gas Hydrates and Free Gas Reservoirs research group at CAGE, working within the SEAMSTRESS project).

    If it’s not a strong wind preventing the recovery of the OBS it’s poor visibility. We stopped the recovery of the OBS late in the night due to fog, and deployed the seismic in the early hours, ready to go at 01:30. We repeated a seismic line that was shot in bad weather from the day before. This time the line started with fairly low winds (9m/s) and then the wind picked back up midway through. When the line was completed, we had to recover the seismic to transit to the start of the next line. It is a lot of work taking the seismic equipment in and out, but we are unable to transit between lines at a good speed with the equipment in the water. Time is everything when working at sea.

    We (the night shift) were let off bringing the seismic back in for the second time in the night. The day shift took over and completed the second seismic line of the day (Line 5). We managed to recover two OBS before lunch, and another at 16:00. All the OBS recoveries went smoothly, and we were joined by a pod of dolphins at 17:40 during OBS # 3 and large number of puffins, in flight circling around the ship. They are the fastest flying birds I have ever seen at sea. They don’t appear to conserve any energy while flying. They look like they are going somewhere in a hurry, and it is almost impossible (using my compact camera) to get a good picture of them.

    It took a little longer than usual to spot OBS # 3. Conditions never seem to be completely perfect for the job! This time the glare on the water made spotting the OBS difficult. Przemek was the only one wearing sunglasses, and was able to strain his eyes to spot the OBS some 300-400 metres away from the ship. What made it even more difficult to spot was that the flag was lying flat against the water, instead of upright.

    Between OBS sites 3 and 9 we transited for an hour. This was a good opportunity to eat the freshly prepared doughnuts left in the mess. What a treat!

    We successfully recovered OBS # 9, and there were hopes to recover the last OBS left on the sea floor, but the fog returned. The day shift OBS team, were exhausted after such a successful day of OBS recoveries and went straight to bed.

    Andreia watches out for the (not so obvious) OBS near the ship.


    The view of the OBS drifting by, moments before catching it, using a hook thrown out to the line to pull it in.


    Mechita and Andreia assist with the winch operation as the OBS lifts out of the water.


    Read more about the SEAMSTRESS project here.

  • Back to site

    Back to site

    Cruise Blog by Frances Cooke: Day 6

    July 12th, 2021

    Text and photo: Frances Cooke (PhD Candidate in the Gas Hydrates and Free Gas Reservoirs research group at CAGE, working within the SEAMSTRESS project).

    Back to site

    We arrived back to site at 02:30 and the weather was less than ideal for seismic. We are limited with what we can do in poor weather, but waiting doing nothing is not a favourable option. We deployed the seismic in a slightly uncomfortable but a ‘safe to deploy’ sea state (winds 12-13 m/s). We started the deployment of the equipment at 04:00 then transited to the start of the survey line starting at 05:30. The line was complete at 08:30 just after our fantastic breakfast of pancake topped with berry jam and maple syrup.

    The day shift (Vera, Mechita and Przemek) were up earlier than usual at 06:00, as the plan was to start the recovery of the OBS, but as it was too windy they had to wait until later on in the day. We decided the next best thing was to start a small multibeam survey. We plan to use the multibeam map to compare with the same data acquired in previous years, to see if there is any slump movement recorded in the sediments (pictured). We completed three lines of multibeam before cutting the fourth line short to recover OBS #5, and #6 once we had entered a calmer sea state.

    Map of the bathymetry (seafloor topography) in the rainbow coloured depth scale, acquired during the small multibeam survey. Orange filled circles are the locations of OBS #5 and #6.

    Recovering OBS #5

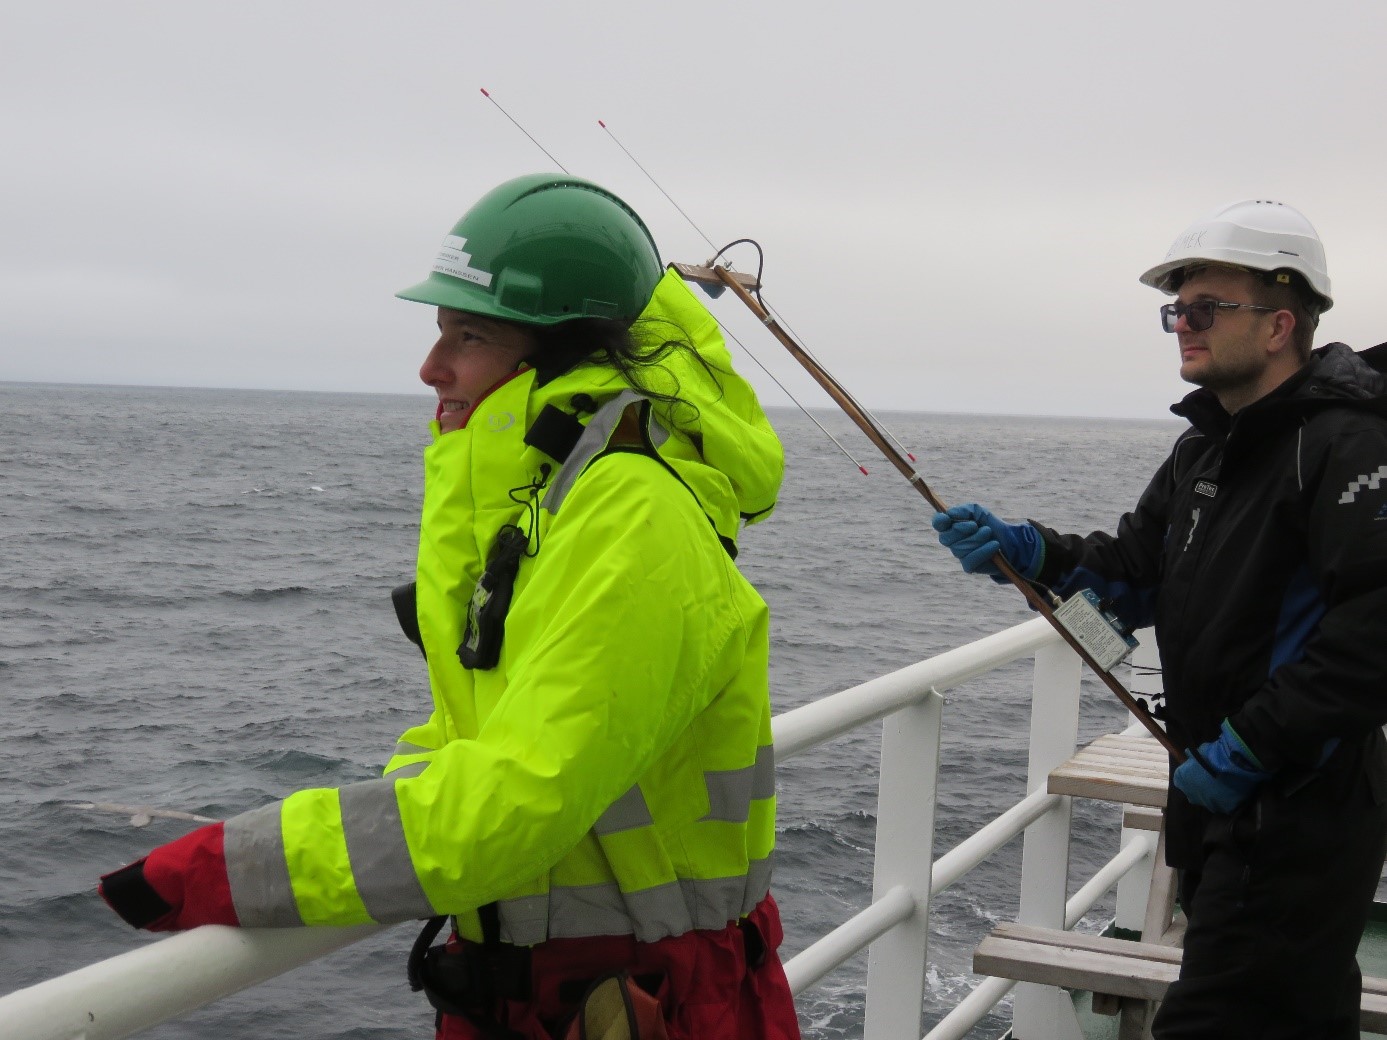
    I hear Vera on the radio at 20:45 “OBS is rising. It’s at 730 metres” so I go up to the bridge to get ready with Truls and Hans (the Captain) to look for the OBS. Outside on the bridge deck are Andreia, Przemek and Mechita ready and waiting for the OBS to come to the surface. Attached to the side of the OBS is a flashing light and radio beacon that sends out a signal in one of four different frequencies, assigned to each OBS. The radio picks up the signal and makes a beeping sound when the OBS is close and Przemek and Mechita are then able to find the direction of the signal in relation to where they are standing on the ship. As the signal can only be picked up close to the ship, relying on sight is sometimes more reliable, so the more eyes on watch the better!

    Andreia and Przemek holding the radio, looking and listening for the OBS once Vera has confirmed that it has reached the surface.


    Read more about the SEAMSTRESS project here.

  • A quick stop in Longyearbyen

    A quick stop in Longyearbyen

    Cruise Blog by Frances Cooke: Day 5

    July 11th, 2021

    Text and photo: Frances Cooke (PhD Candidate in the Gas Hydrates and Free Gas Reservoirs research group at CAGE, working within the SEAMSTRESS project).


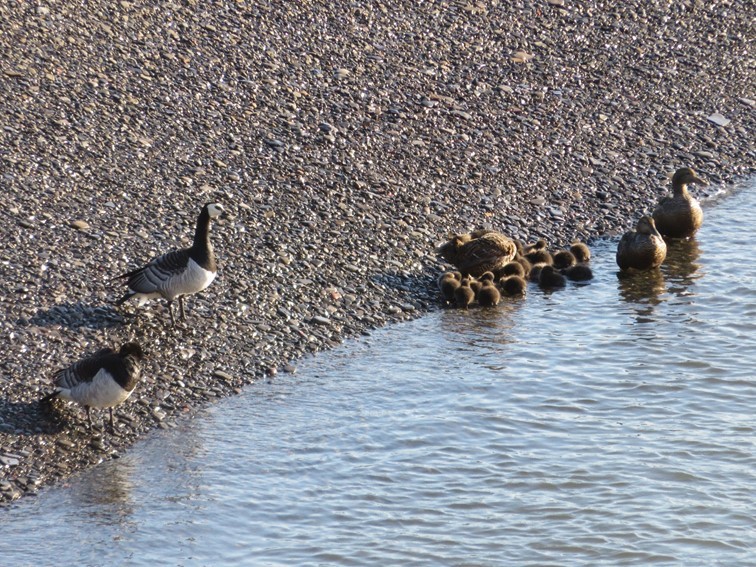
    We arrived into Longyearbyen 05:50 on what was a very pleasant morning. We tied up to the wharf in view of the seed vault and joining us were three adult common eider ducks (ærfugl) and their 21 ducklings, together with two adult barnacle geese (Hvitkinngås in Norwegian – ‘white cheek goose’). I had initially thought that the eider ducks were pink-footed geese, until Stormer corrected me. He told me a story about an ærfugl he found on the aft of the Kronprins Håkon. On a cold, stormy November day while on the way to Greenland, Stormer moved a stack of pallets to prepare for coring, and there standing before him was a duck. The duck was standing so still, the first thought that came to mind was “who brings a wooden duck onboard?” He took a step forward to take a closer look, to find that the duck was in fact a real duck. An ærfugl. The crew kept her warm and fed, and released her back into the wild in Tromsø.


    Two barnacle geese, three common eider ducks and their 21 ducklings

    It was a quick turnaround, and we left Longyearbyen at 15:00 after our new crew member joined the ship. The plan is to deploy the seismic at 03:00 on our return back to site, however plans can quickly change and the order of activities is dependent on the weather forecast. We left behind bright skies in Longyearbyen, with a striking display of cirrus and cirrocumulus clouds. After eating match-worthy food – chili and nachos, and watching the intense euros finals game, we wait three more hours and hope that the waves will calm for the seismic deployment.


    Prins Karls Forland in the distance with magnificent cloud formations – originally named Prince Charles’ Foreland after King James’ son in 1612.


    Read more about the SEAMSTRESS project here.

  • Successful OBS recovery

    Successful OBS recovery

    Cruise Blog by Frances Cooke: Day 4

    July 10th, 2021

    Text and photo: Frances Cooke (PhD Candidate in the Gas Hydrates and Free Gas Reservoirs research group at CAGE, working within the SEAMSTRESS project).


    While the night shift took some rest, we successfully recovered one OBS (no. 10) at the northern termination of Knipovich ridge (NKR). The original plan was to recover two OBS but the visibility was too poor. The breaking waves made the search for the OBS a difficult task!


    Clock Drift

    ‘DIRC’ Clocks in the OBS are temperature sensitive. When the clocks are recovered they need to be synchronized right away before they warm. They are synchronized at the beginning (pre-deployment) and at the end (on recovery). It is known that during the experiment the clocks drift linearly. This clock error is applied automatically which addresses the linear drift problem. However, there is also non linear drift which is a much more time consuming fix (requiring several weeks of processing). Vera tells me that the new manufactured (AWI) seismometers were fitted with clocks that have worse drift than the old seismometer clocks. They are less power consuming but the processing as a result is more time consuming!

    The seismic deployment began at midnight, and we were ready to start our first 2D seismic line by 01:30 AM. During the night shift we will complete at least 2 survey lines that will take approximately 3 hours each to shoot (line distances: ~25 km). The sea feels a little rough (2m swell), but by tomorrow evening the wind will drop.

    Bathymetry map displaying NKR survey area with seismic lines and OBS pick up locations (orange), the red cross marks the retrieved OBS no. 10 (recovered late in the evening on day 3)


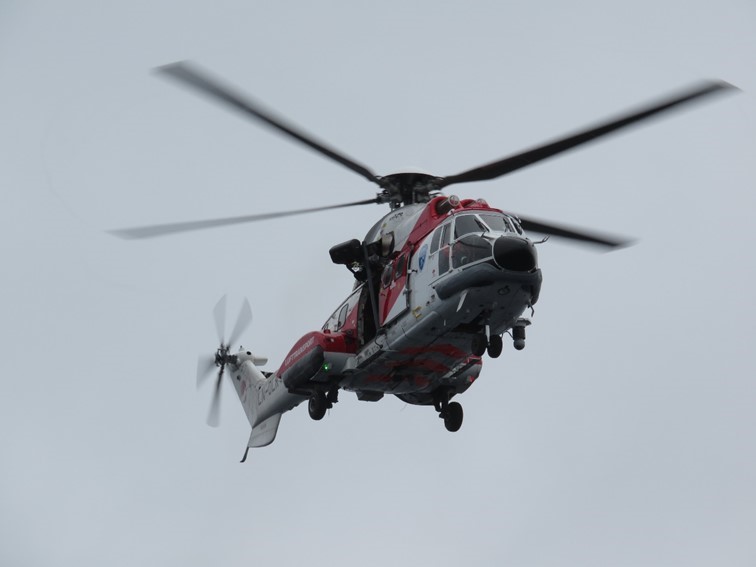
    We completed four seismic lines, finishing the last line just after 18:00. We had to stop work and recover the seismic instrumentation after an incident onboard required a helicopter rescue. We had planned to start OBS recovery at midnight during the calm weather, but now we will head to Longyearbyen and wait for a replacement crewmember to join us.


    A very impressive and quick helicopter rescue operation


    Read more about the SEAMSTRESS project here.

  • The unpredictability factor during a cruise

    The unpredictability factor during a cruise

    July 9th, 2021

    Text and photo: Andreia Plaza-Faverola, chief scientist SEAMSTRESS/CAGE cruise.


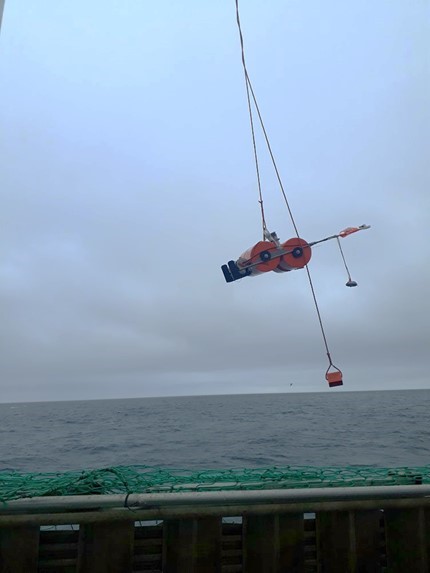
    We have been waiting for an ideal weather window to collect the OBSs. Once released from an iron frame that keeps it at the bottom, the OBS starts rising through the water column at about 1 m/s. When it makes it to the surface it is good to have visibility and no waves, so it is easy to see it. We dared to get one under relatively strong winds and it was a bit of a stress to find it – the wind creates superficial waves where the OBS can hide. The crew found it from the bridge using the binoculars. There was a significant drift and we saw it several hundreds of meters north from the ship. It felt like a big relief when Jan came out to tell they had it on site. They fished it fairly easy and the data looks great.


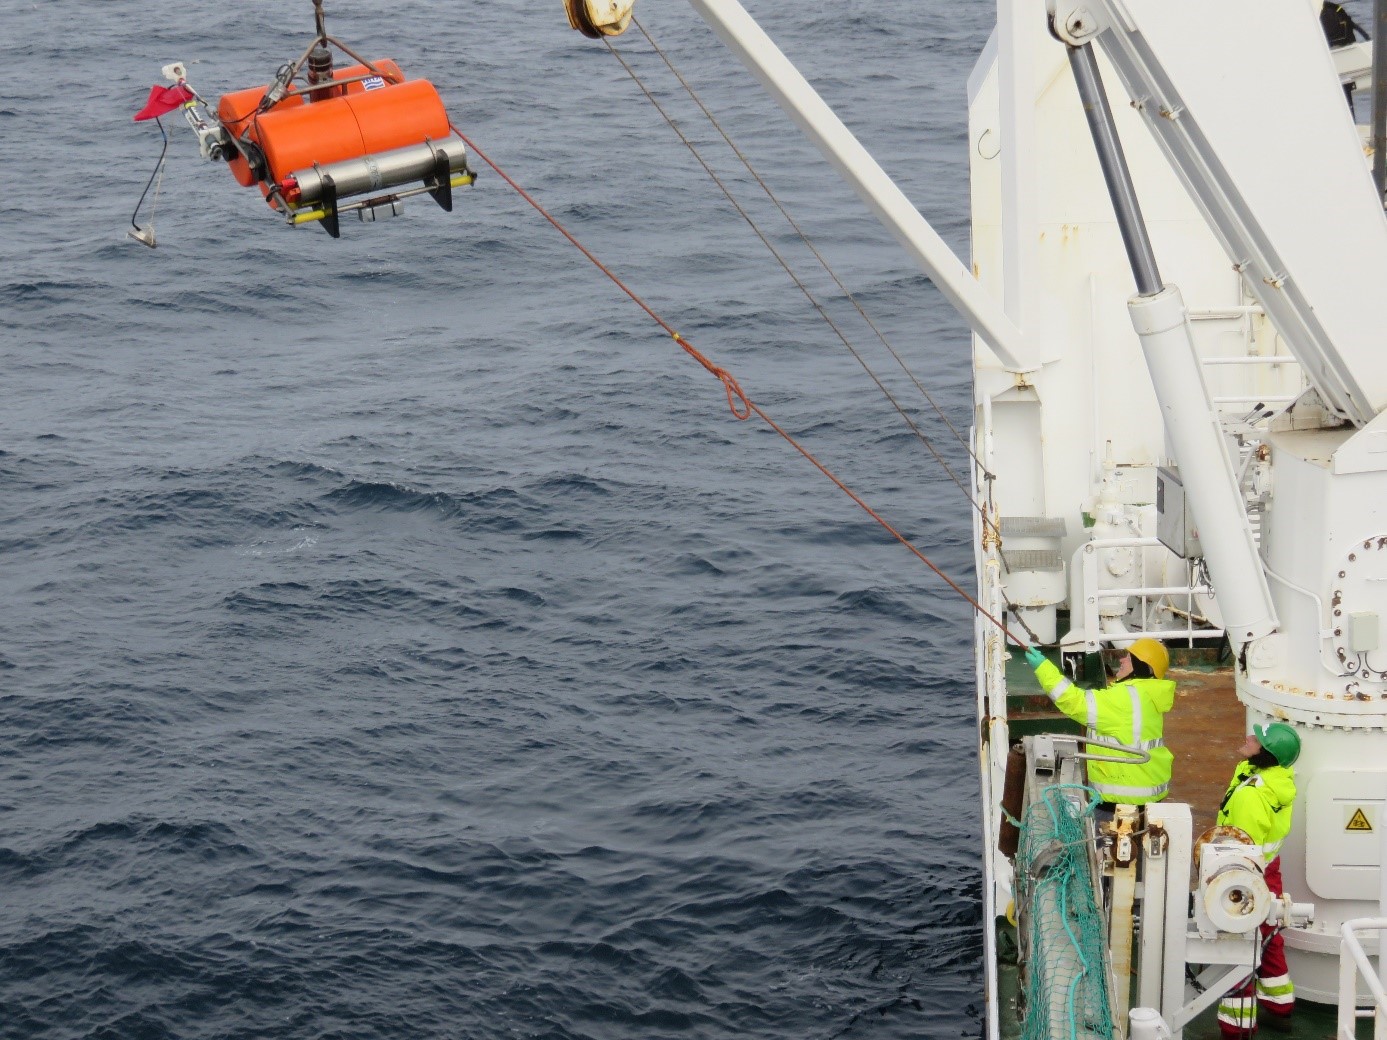
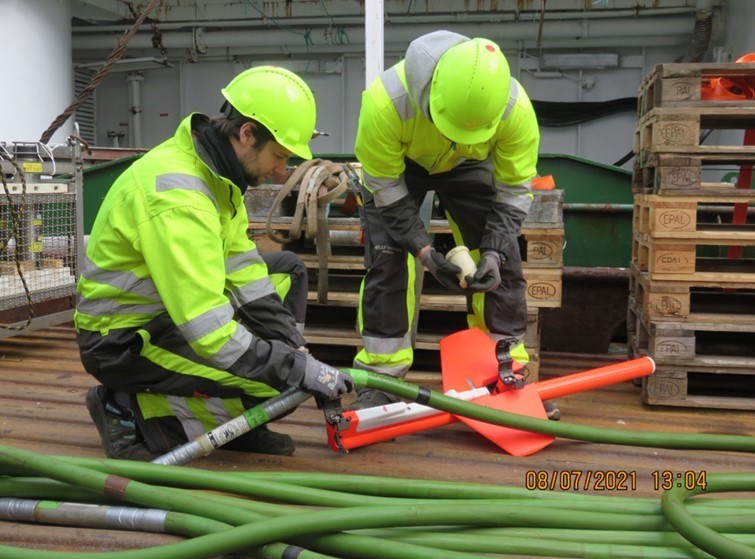
    Our first Ocean Bottom Seismic recorder (OBS) is on deck – it is called the “Lobster”. This is one of 5 OBSs we have at the Department of Geosciences at UiT. The little flying-saucer hanging from a flag pole is the seismometer that records both, compressional and shear waves that propagate through the ocean floor. A hydrophone (that only records waves that propagate through the water) is placed over the floating frame (orange cylinders), next to the devise that releases the instrument from the iron weight so it can come back to the surface. 


    We decided to keep waiting for the wind to ease down. We started then with the seismic lines. We collected 4 lines and we were ready to continue with the recovery of OBSs when the Captain informed that we needed to sail to Longyearbyen because our machinery guy injured his hand. A helicopter picked him up and that was quit an impressive operation. Helmer Hanssen doesn’t have a heliport so the helicopter stays in the air while a rescuer descends with a rope to get the injured person from the front deck of the ship – incredibly professional and impressive operation. Feeling respectful of those with that metier…

    A roundtrip to Longyearbyen and back after having a replacement “makinist” on-board will take us around 22 hours. Now we are leaving the pretty mountains of Svalbard in the background under a wiggly sky. Tonight we expect to continue with seismics and tomorrow early get on track with the recovery of the OBSs.

    But who knows what will happen, there is always that factor that makes our research cruises in the Arctic, unpredictable…

    The Mountains of Marineholmane stays in the background with a funny sky


    Read more about the SEAMSTRESS project here.

  • Instrument preparations are underway

    Instrument preparations are underway

    Cruise Blog by Frances Cooke: Day 2

    July 8th, 2021

    Text and photo: Frances Cooke (PhD Candidate in the Gas Hydrates and Free Gas Reservoirs research group at CAGE, working within the SEAMSTRESS project).

    Preparing the instrumentation

    Temperatures have dropped and the skies are grey. The bathymetry (map of the seafloor) shows a typical Barents Sea display of iceberg ploughmarks cut deeply into the seafloor as we cross over the ‘Polar Sonen’ – a blue line displayed on the ship’s navigational map extending from Russia through to Iceland. We are still 1 day and 14 hours away from our OBS recovery site, but we have some tests to do along the way.

    Barents Sea real time bathymetry swath with iceberg scours (yellow)

    Preparation: OBS releasers

    We are preparing our OBS releasers for testing at ~1250m water depth, away from the shallow Barents Sea continental shelf. It is important to test the instruments at the same water depth as the OBS site to ensure a comparable pressure. The releasers are the most important part of the OBS to test. If they do not function correctly, the OBS will fail to return to the surface. They are called back using an acoustic device that sends a command through the water to the instrument instructing its release. We will lower the cage with all six releasers (1 from CAGE (Seamstress) and 5 from AWI) and we will talk to them and wait to see if they talk back. Bergen University were lucky this year to recover their ‘lost’ OBS picked up during the AKMA CAGE cruise in May using a remotely operated vehicle.

    The OBS releaser cage with two releasers inside (4 more left to prepare)

    Top left: all releasers ready to be deployed (in view Kathi, Kunigunde and Kordula). Emma, Diana, Christine and Wojtek – the easily identifiable instrumentation from the Alfred Wegener Institute.

    OBS naming

    Five of the releasers have names: Kunigunde, Kathi, Kordula, Kaya and Kim. Vera and Machita inform us that all the parts that make up the OBS (hydrophones, frames, beacon, releaser etc.) have names. The names made for the releasers start with a letter K or L. In the labs at AWI, they have in total ~1000 pieces of equipment to manage, including auxillary parts such as laptops, deck units, and cables. They have 80 OBS equipment groups. Each OBS group is comprised of 10 parts. The serial numbers are so similar that naming the equipment makes it much easier to identify them. I ask how they manage to find names for 800+ OBS parts, and they reply that the names are both male and female, and both German and foreign.  The names are also old fashioned such as Kunigunde. Watching the Denmark-England game last night was possibly as intense as the half hour wait time during the recovery of the OBS – at least for some. Others discussed the names of the players:  Boleslaw – an old-fashioned Polish name. A good reserve name for a Beacon.

    Top: The deployment of the releasers cage, bottom: Przymek, Vera and Mechita watching the winch wire go out, waiting for the cage to drop down to 1250m before communication with the releasers begins.

    While Vera, Mechita and Przymek were preparing the OBS releasers, Truls and Stormer were preparing UiT’s two ‘Digi-birds.’ This is equipment used to control the depth of the cable in the water for seismic operations. The birds are mounted externally on a marine seismic streamer cable. They have acoustic devices that measure actual depth of the cable during operation, through an onboard sensor located in the wing module. Periodic adjustments are made to the angle of the birds wings (or “fins”) to drive the bird (and streamer) back towards the target depth.

    Top: Truls and Stormer fix the wings to the birds; bottom: Truls and Stormer attach one of the birds to the streamer cable on deck.


    Read more about the SEAMSTRESS project here.

  • Transit to Vestnesa Ridge – West Svalbard

    Transit to Vestnesa Ridge – West Svalbard

    Cruise Blog by Frances Cooke: Day 1

    July 7th, 2021

    Text and photo: Frances Cooke (PhD Candidate in the Gas Hydrates and Free Gas Reservoirs research group at CAGE, working within the SEAMSTRESS project).

    Day 1:

    We departed Tromsø on the Helmer Hanssen before our first, of likely many, onboard fish lunches. We were glad of the sea breeze after the unusual Arctic summer heat during the past few days. The seas are calm which is always a relief knowing that your journey north is going to be a smooth one and we found the server machine room the perfect place to cool down! We are in transit returning to Vestnesa Ridge – West Svalbard to recover earthquake data from previously deployed ocean-bottom seismic instruments (OBS). OBS are instruments that contain seismometers and hydrophones that sit on the seafloor, listening and recording vibrations from shallow earthquakes.

    Last view of the land: Vannøya

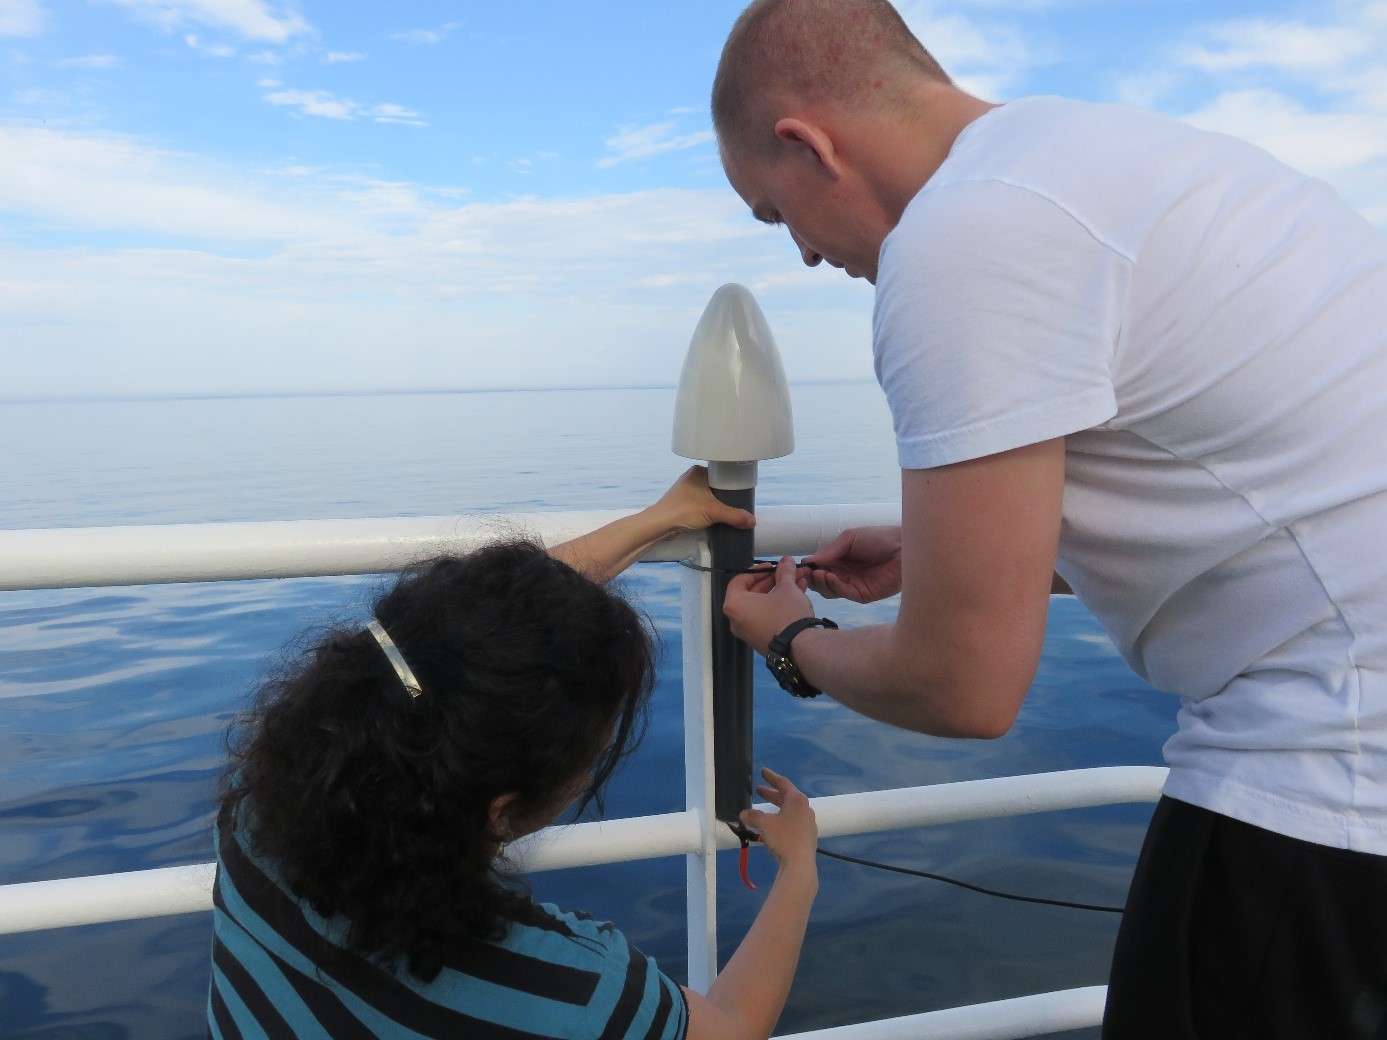
    Onboard we have two of our colleagues from the Alfred Wegener Institute (Vera and Mechita), three from the Seamstress project (Andreia, Frances and Przemek) and two technical engineers (Stormer and Truls). We are busy setting up the GPS required for the active OBS experiment that will take place at the west of Vestnesa ridge. We have Sunil (in-house expert) present through video call while we are near shore! The setup ensures that we have precision in the timing and positioning of each shot fired during the active experiment.

    Figures for planning of the active source experiment. The green filled circles (right) are 8 OBS deployment locations. The survey lines and circles are for the seismic planning.

    Stormer and Andreia attach GPS antenna to railing

    Last year during cruise CAGE20_5 we recovered 7 OBS as part of the Seamstress passive seismic experiment. This experiment took place between July 2019 and August 2020. The OBS instruments in the passive experiment record signals generated by earthquakes or other natural sound waves such as whale calls, instead of being actively generated by airguns. During the same cruise, we deployed 10 more OBS to begin a new experiment at the northern termination of the Knipovich mid-ocean ridge. We are now on our way back to recover them.

    Figure from CAGE20_5 cruise report. Pink triangles are the OBS we are on our way to collect (North of the Knipovich mid ocean ridge – West Svalbard)


    Read more about the SEAMSTRESS project here.

  • A new cruise season starts – what will the Ocean Bottom Seismometers we left last year tell us?

    A new cruise season starts – what will the Ocean Bottom Seismometers we left last year tell us?

    We are looking forward to get the Ocean Bottom Seismometers (OBS) up and see whether they have something interesting to reveal about the movement of the earth and the methane down there in the deep ocean.

    Text and photo: Andreia Plaza-Faverola, chief scientist SEAMSTRESS/CAGE cruise.

    July 7th, 2021

    Planning a cruise this year has obviously not been easy – why should have it? We are all across the planet leaving a difficult time.

    But here we are, we got onboard for a 15 days research cruise with the main objective of recovering the OBSs that we deployed last year (see previous posts). We are a compact scientific crew this year: Przemek, Frances, Vera, Mechita and Andreia, with support from our engineers Truls and Stormer (nothing to complain about the gender balance). For the first time in many years I am coming to an OBS/seismic cruise without Stefan and Sunil and the possibility of not managing to get a code or a program running makes me anxious. 🙂

    We left Tromsø in calm waters with a suffocating temperature of nearly 30 C. Now we are back to Arctic temperatures…We have used the transit to set and test software and equipment. Tomorrow we will be on site by 18:00 to pick up the first (southernmost) OBS from 10 we have in the water at the northern termination of the Knipovich Ridge.

    Just a few minutes ago they called us from the bridge to see a bunch of Fin whales and dolphins playing together very close from the ship. The perfect spectacle to continue the transit.

    Photo: Sailing in the fjords on R/V Helmer Hanssen, in a calm sea at 30 C


    Read more about the SEAMSTRESS project here.

  • The last station

    The last station

    We left the Greenland Sea in a rush! After searching for ice-free waters and mapping those during a 24-hour long station, we had to leave the sea ice due to upcoming bad weather.

    Text: Jochen Knies, chief scientist NGU/CAGE. Photos: Mauro Pau, researcher, CAGE.

    November 27, 2020

    Southerly winds and a high chance of thick sea-ice ridges left us with no alternatives. Unfortunately, we did not reach the Greenland shelf region, and thus we were not able to document the leaking methane. A winter cruise towards Greenland is simply too unpredictable, but the experience we have gained during the past days will help us to get better prepared for forthcoming opportunities. Still, happy faces everywhere with the material we have collected.

    Professor Tine Lander Rasmussen was happy with her catch.

    Not many cruises before have achieved what we have collected during the last days. This is material that will help us find out how far the Greenland ice sheet has expanded towards the North Atlantic Ocean during the last ice age. And, more importantly, how fast the ice has melted away in the past. After plenty of night shifts, we took it easy for the final days easy with time for football and group photos.

    Socially distanced fotball on the deck of an ice breaker. Why not?

    We thank the captain and crew onboard RV “Kronprins Haakon” for all their support and we looking forward to more Arctic cruises in the coming years.

  • Most fabulous experience

    Most fabulous experience

    The Arctic ice pack is a natural wonder. Observations over the past decades show that is drastically shrinking and in our lifetime it may disappear for parts of the year. We are privileged to have seen it now.

    Text and images: Mauro Pau, researcher CAGE.

    23rd November

    A storm from the south will hit us on our way back to Tromsø. The captain decides therefore to start our way out of the sea ice. Better not be here when the strong southerly winds will blow, compacting the sea-ice cover. As a consequence, the acoustic team has to come up with a new surveying plan suiting the new situation.

    A new gravity core is positioned on the deck.

    The most appealing scientific problem in the vicinity lies at 3000 m water depth on the northern flank of the East Greenland Ridge, a topographic high that originated during the opening of this part of the Atlantic Ocean. The ridge has been deflecting deep ocean currents ever since, and while doing so the currents weakened and lost their sediment load. The resulting contourite deposits, as they are called, could potentially reveal information on the temporal variability of the thermohaline ocean circulation, which redistributes heat around the globe.

    Cruise leader Jochen Knies has a first look at the freshly retrieved gravity core.

    24th November

    We carry out our measurement and sampling program at three stations, this time deploying also the heat-flow probe at the deepest of the stations (3100 m). It takes about one hour to lower each piece of equipment to the seabed, and another hour is needed to bring it back on board. This means that we spend the whole day surveying the area. Once we are done, it is time to start our journey back to mainland Norway.

    25th–26th November

    Steaming across a moonlit ocean, the captain manages to avoid the storm and brings us safely to the northernmost coast of Finnmark, near North Cape. Life onboard goes on with some work in the labs, cleaning duties, chatting in the day room, and the usual meal times. Passing from 78 to 72 degrees of latitude has remarkable effects: now there is light in the sky around mid-noon, and the frozen sea spray on deck is thawing!

    27th November

    We pass North Cape at 3:00 AM, and just over two hours later we reach the first sampling station. We then proceed to survey and sample the interior of Tanafjorden.

    Deploying a CTD cast to measure hydrographic properties of seawater

    At 10:00 AM we start our journey to Tromsø. The expected storm has arrived, but we are navigating safely through the spectacular fjords of northern Norway. We will arrive in Tromsø tomorrow morning.

    General impressions

    Despite the odds, we can be happy with what we have achieved. The quantity of the data is not abundant, but we did collect great quality data in a sea-ice setting in a time of the year polar expeditions are, to say the least, not common. We have pushed the limits of what R/V Kronprins Haakon can do, and have acquired fabulous experience.

    The Arctic ice pack is a natural wonder. Observations over the past decades show that is drastically shrinking and in our lifetime it may disappear for parts of the year. We are privileged to have seen it now. At least some of us got deeply fascinated by that extreme environment, so much so that from the moment we left the sea ice we felt the urge to go back: there where even liquid seawater is below zero degrees Celsius, where an immense table of frozen ocean surrounds you, the night is several months long, and polar bears roam, sometimes under the northern light.

  • Polar bear in sight!

    Polar bear in sight!

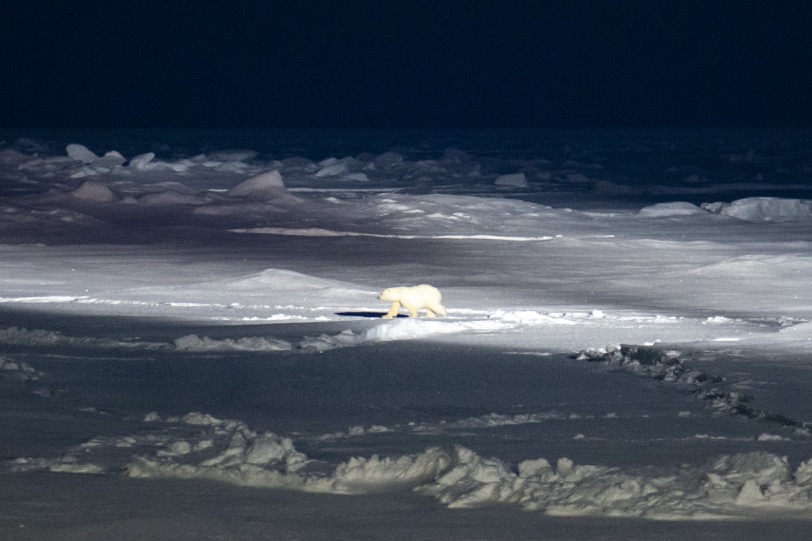
    It happens during the sea-ice coring when Anna Silyakova, Henry Patton and Christine Lockwood-Ireland are on the ice pack. The team has to leave coring and get quickly onboard where they can enjoy the sight of the big carnivore passing by with the rest of us.

    Text and photo: Mauro Pau, researcher CAGE.

    (more…)

  • Harvesting the DNA

    Harvesting the DNA

    Watching the ice break is as captivating and mesmerising as watching the fire burn.

    Text and photos: Mauro Pau, postdoc CAGE

    (more…)

  • Beauty of the Dark

    Beauty of the Dark

    A November cruise towards Greenland is challenging. You only realise it when you face it.

    Text and photos: Jochen Knies, researcher NGU

    (more…)

  • The sound of sea ice hitting the hull

    The sound of sea ice hitting the hull

    This cruise will be a bit of an adventure, in that it is the first time someone attempts to search for methane release through the seabed during winter times in the area.

    Text and photo: Mauro Pau, postdoc CAGE

    (more…)

  • Greenland in the Dark

    Greenland in the Dark

    Shall I start with COVID-19? Yes. I can assure you that we keep social distancing, wash our hands regularly, and follow all the guidelines and measures given to us! We hope to stay safe and healthy.

    Text and photos: Jochen Knies, researcher NGU

    (more…)

  • Picking up plastic trash

    Picking up plastic trash

    According to a study from 2015 1, between 4.8 to 12.7 million tons of plastic end up in the ocean per year. Everyone has already heard about the “plastic continent” of macro- but mostly microplastic swirling in the world’s gyres. But, everything is connected.

    Text: Marie Stetzler

    The ocean currents are a huge two-lane-highway around the globe with the water’s salinity and temperature gradients as the main motor of transport: surface currents hence stream in a different (mostly opposite) direction than deep-sea currents. And like on a proper highway, there are plenty of exits, branching out in complex, always thinner paths, leading the currents to the most remote places. That plastic would also end up in the Arctic, transported by the West Spitsbergen Current, was just a matter of time.

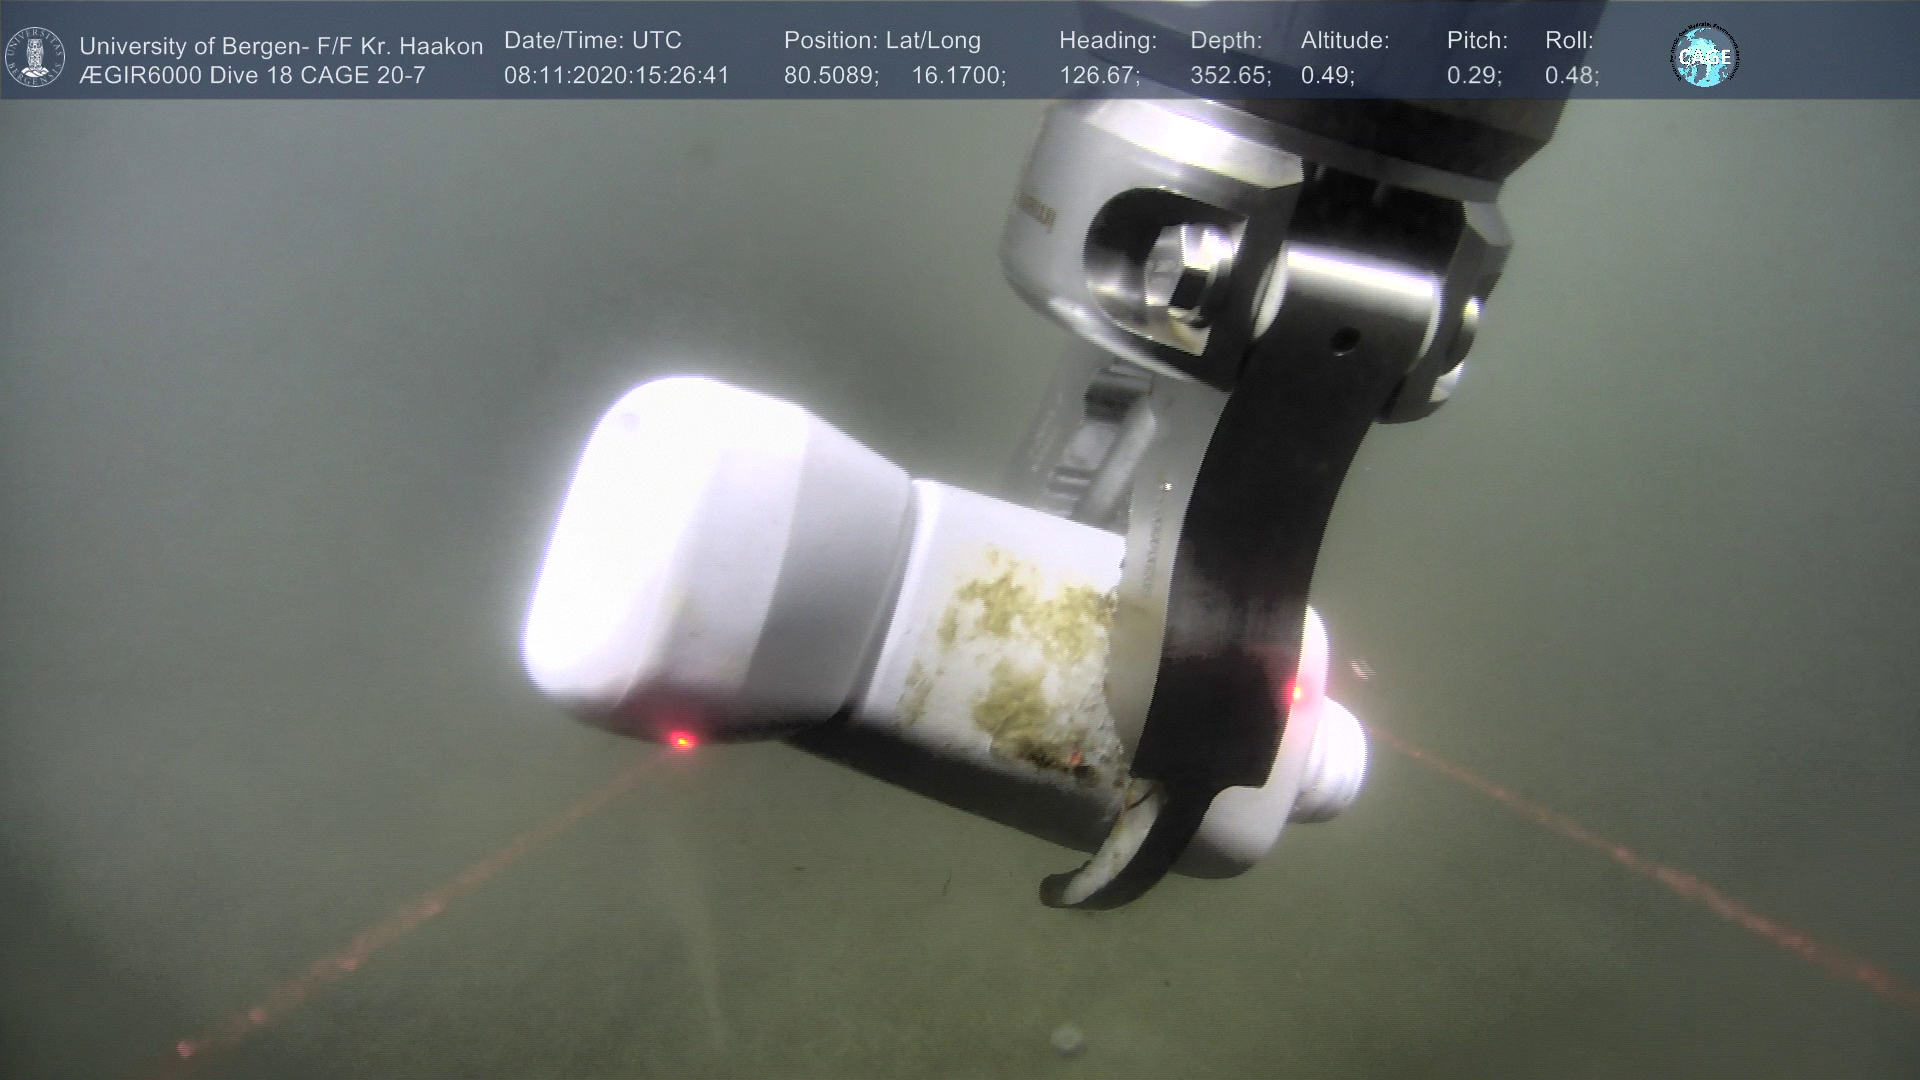
    Still, it is a bitter reality-check when the lights of our underwater robot the ROV (Remotely Operated Vehicle) laid down on a white plastic bottle. And this at 353m depths and 80° N, miles away from the next soul, and even hundreds from the closest settlement. Our environmental consciousness forbidding us to leave this piece of trash behind, we pick it up with the ROV’s pliers. But even for a piece of plastic scientific interest can be found: the “fouling”, so micro- and macroorganisms which inevitably settle on all submerged surfaces after a while, are worth investigating.

    Plastic is a light material, nevertheless, most of it won’t float on the ocean’s surface. It is the weight of the fouling that will drag it down to the bottom of the ocean, as will currents. Around 80% of the plastic in our seas is therefore lying on the ground 2. In absence of light, oxygen, and weathering, it won’t be degraded and can remain there, preserved for centuries, eventually becoming a new habitat for organisms. Not the nicest trace left behind by humankind, but at least this white bottle won’t go down in the geological records of the Anthropocene.


    1 Jambeck,J.R., Geyer,R., Wilcox,C., Siegler,T.R., Perryman,M., Andrady,A. ,Narayan, R.,
    Law,K.L. (2015) Plastic waste inputs from land into the ocean. Science. 347, 6223, 768–771.


    2 François Galgani, French research scientist about ocean plastic at IFREMER. Personal
    communication.

  • “Have you not succeeded? Continue! Have you succeeded? Continue!” – Fridtjof Nansen

    “Have you not succeeded? Continue! Have you succeeded? Continue!” – Fridtjof Nansen

    What is it that attracts the explorer’s heart so much to the sea? To the small island that a ship will be for you for two weeks? To the lonely darkness of the Arctic in winter?

    Text and photos: Jenny Friedrich, Geomar.

    (more…)

  • Fish gets in the way

    Fish gets in the way

    You never stop learning. That this is the core philosophy of our profession and the reason for our presence on the rough seas at 80°N in the Arctic goes without saying. But it also applies on a personal level.

    Text and photos: Marie Stetzler.

    After a first cruise on the smaller and cozy R/V Helmer Hanssen, a new dimension of ship-going-expeditions opens up to me here on the R/V Kronprins Haakon, to find methane flares… and have some unintentional bycatch.

    On our arrival at the harbor in Longyearbyen in the polar night for boarding, the first noticeable difference to the R/V Helmer Hanssen was that it was not just a ship waiting for us at the dock, but a floating building. Ten decks high, illuminated with uncountable lights, as if someone was a little early in their set up of fancy Christmas decoration. The view is both impressive and exciting. As soon as we set foot on deck, we enter a world that is both a 4-star hotel and a high-tech lab. This will be our home for the next two weeks. You can easily get lost on various decks, rooms, labs, and the hangar on the first day,  which is reason enough to explore every corner of the vessel, including the outside decks. You quickly learn that the heart of the ship is the mess, all paths lead to it and the meals are delicious. And deck nine, almost the ship’s highest, is immediately identified as my personal crow nest. Another surprise that awaited my fellow rookies and me in the hangar: having a huge hole in the ship’s hull can actually be advantageous. The big hatch, called “moonpool”, opens indeed directly into the open sea, as the constant stream of water rushing in and out of the pool confirms. It is used for the deployment of our underwater robot, the ROV (Remotely Operated Vehicle). This jewel of technology is our eyes and hands underwater. It will serve both the microbiologists on board by taking sediment probes, which are biogeochemical registers of past and present seepage activity. As for the geologists, it will gather data about the bubbles that are necessary for an assessment of methane in the water column, as well as catch some for analysis. The multibeam (a type of sonar) will guide our efforts by showing us where to find the flares. Water column sampling will tell us how the methane venting affects the ocean’s chemistry and biology.

    But all these measurements have one prerequisite: finding flares! We know from previous surveys in the area that we are on the safe side, activity has been reported in our area north of Svalbard multiple years ago already. And indeed, a survey with the multibeam reveals the presence of flares. They don’t seem very prominent, but they have the merit of existing and we deem the biggest one worth a visit by the ROV. Only… the visibility of the ROV is just a fraction of the multibeam’s coverage. The coordinates of the flare are known, but hunting for it in the area still equals searching for a needle in a haystack. Except that this haystack is the  170 m deep, with gravel, sand, and sponge covered seafloor. Bubbles in this background are merely a passing shimmer. Patience and a sharp eye are our friends as the robot hovers through the water. The seep must be close, all the signs are there: carbonate crusts and white bacterial mats. Until, yes, we see single bubbles rising through the water. The camera zooms to its source. Our load of measurements can now be deployed. Let the seep-science begin!

    * * *

    Or so we thought. After having already deployed a couple of instruments on the seafloor, the ROV dove down again, this time with the bubble catcher to collect some bubbles over the seep site. But we’re not alone in the sea. On the descent, the ROV crossed a dense swarm of fish attracted by the lights, unintentionally transforming the bubble catcher into a fishing device… In the transparent gas collector, several of them got trapped. Not being the cleverest creatures, they keep swimming upwards in the opposite direction of the exit. Turning the bubble catcher to the side, shaking it… nothing helps, the fish stay stuck. The ROV has to surface and get rid of them before pursuing the experiment. Finally, the “fishless” catcher got deployed and could collect some seep gas. From now on we had located other good flares and the rest of the measurements could go on. Maybe the ship crew even got fresh fish for dinner that night?


  • Rituals after our Arctic expeditions

    Rituals after our Arctic expeditions

    It has become a tradition that when we finish an expedition in Longyearbyen, we celebrate the hard work with dinner in one of the few restaurants in town, Kroa.

    Text and photo: Andreia Plaza Faverola, researcher. Project manager, SEAMSTRESS.

    A day before reaching the harbor Sunil had already booked our table. This year we were the right number of people and got the Round Table, just like King Arthur’s knights. Several hours before our closing dinner we were already in town having some drinks together. We continued with the dinner and finished with a round of emblematic bars in Longyearbyen.

    I write about this because it made a big (good) impression on me, to see a lot of life in the bars and streets of Longyearbyen despite all the unusual rules that we have to follow to continue with our “normal” lives. Longyearbyen is a strange place; the city and the people here are full of energy.

    We had a cozy night together and some of us came across the ship crew and could interact with them as well outside work. Rituals are important! They mark and create time, they define beginnings and endings in our social cycles, they strengthen social relationships.

    Now ready to go back home.

    We finish the cruise and the season. The sun tells us good bye and see you in a while…
  • Into the fjord

    Into the fjord

    For the last two days, we have been waiting for the arrival of the bad weather, which stopped our activities and made us sail into the fjord.

    Text and photo: Andreia Plaza Faverola, researcher. Project leader, SEAMSTRESS.

    Here we are now, enjoying the calm waters in the shadow of “Fuglefjell” in one of the Kongsfjorden branches.

    We managed to recover the last two piezometers and completed more than 20 heat flow stations right before the arrival of strong winds and big waves. I feel relieved. We have had intense days full of data and full of emotions. Now we just wait here, we play basketball; we get lost in philosophical discussions and sophisticated speculations about the results.

  • Vestnesa is hot with fever

    Vestnesa is hot with fever

    When I Ieft for the cruise I had strong mixed feelings about leaving. My one-year-old had had a high fever (40!) for three days and I was leaving him there feeling miserable…Luckily that same day the fever had started to drop. But the image of a thermometer and high temperatures has not left me.

    Text and photos: Andreia Plaza Faverola, researcher. Project leader SEAMSTRESS

    We have put the thermometer to good use at least 50 times to measure Vestnesa’s temperature. My son had a 12% increase in his average body temperature. Vestnesa has a 14-17% increase in the average temperature at passive continental margins. So Vestnesa also has a high fever.

    Sunil Vadakkepuliyambatta connecting the cable for data transfer after recovery of the big thermometer.

    It is not so concerning though, the reason for the high fever is the proximity to the Molloy and the Knipovich mid-ocean ridges. There is a lot of heat released at the axis of drifting plates because hot, sometimes melted, material from the mantel is reaching the Earth’s surface and getting in contact with the ocean. Interestingly, there are places close to the mid-ocean ridges where the temperatures are actually lower than expected. Here, a thicker sedimentary cover seems to be working as cold compresses.

    I really hope that after this cruise I won’t be seeing a thermometer for quite a while…


  • It’s all about that heat and stress (tectonic, of course)

    It’s all about that heat and stress (tectonic, of course)


    We had a rough transit from Tromsø to the Fram Strait. Six-meter waves and strong winds slowed us down to a sailing speed of six knots (normally this type of vessel navigates at 10-11 knots). We left Ramfjord at about 15:00 on Saturday (the 17th) and arrived on-site The Vestnesa Ridge on the west-Svalbard continental margin three days later.

    Text and photos: Andreia Plaza Faverola. Researcher CAGE, project manager SEAMSTRESS.

    (more…)

  • Mixed Emotions

    Mixed Emotions

    Setting up a demanding scientific expedition to the Arctic Ocean in the midst of a pandemic brings about a very mixed set of emotions.

    Text and photos: Andreia Plaza Faverola, project leader SEAMSTRESS.

    The Norwegian research vessel Kronprins Haakon (KH) is an ice-breaker class vessel that allows surveying and sampling is usually inaccessible polar areas. But our preference for KH, over other research vessels available to us at UiT, goes beyond the need of breaking into the ice. KH has a so-called A-Frame with powerful cranes and winches, in addition to ample space on deck and a system to accurately keep a position. This makes it possible for us to use advanced marine instrumentation, such as rigs for sediment drilling and piezometers (e.g., Ifremer piezometer).

    The Ifremer piezometer was successfully used last year during the first SEAMSTRESS cruise and is the centre of the experiment this year. This instrument is teaching us that the pressure of the water and gas inside the sediment changes with small fluctuations in the sea level, for example, tides, which are in turn caused by the gravitational forcing from the moon and the sun.

    It is just amazing to think that there can be such a close connection between the methane seepage phenomenon and forces beyond our Planet.

    The crew of R/V Kronprins Haakon brings each piece of equipment on board with the cranes at the Breivika docks in Tromsø

    Se

    Now the other face of my emotions – We brought with us two sets of piezometers and sensors to maximize the time onboard and collect pressure and temperature data from at least four stations. However, many challenges have shaped the start of the cruise and our original plan slowly became an illusion. Loading the ship with tens of individual boxes and dispersed equipment for ours, and other expeditions, shaved two days off our cruise time. Packing issues delayed necessary work that had to be done on the deck while the ship was still on the quay. We are just learning that packing for an expedition is an art, and if mastered it can save days. A single day’s delay is critical for an Arctic expedition during this time of the year, where a window of good weather is just gold. But there were more delays to come. Before we could set foot on board, a negative corona test result for one of the new crew members had to be in the captain’s hands. We also used some precious time for the bunkering (filling the tanks) over the night.

    Luckily, we are in good hands and with great people. Exciting discussions about science, politics, entertainment and exotic (Arctic) landscapes, keep us occupied as we are heading north.

    As the cruise participant, I am craving for some action. As the cruise leader, I am just praying to the Viking gods for a long golden weather window and fewer unaccounted challenges in the days to come.

  • Mud everywhere

    Mud everywhere

    Adventdalen on Spitsbergen, like many other glacial valleys in the High Arctic, is punctuated by groundwater methane springs. A year ago, we started exploring these active greenhouse gas sources.

    Text:  Dimitri Kalenitchenko, CAGE and Alexander Tøsdal Tveit, Department of Arctic and Marine Biology, UiT .
    Photos: D. Kalentichenko

    (more…)

  • Hidden Fractures of the Mother Earth

    Hidden Fractures of the Mother Earth

    Text and photo: Andreia Plaza-Faverola, researcher CAGE; project leader SEAMSTRESS.

    By the time the last Ocean Bottom Seismometer (OBS) was diving deep into the ocean, big waves and strong winds reached us. We spent a day or so surviving that feeling of seasickness that accompanies you for a while even when you get back ashore.

    Our next objective was to investigate how the geology underlying the OBSs. For this the University vessel ( RV Helmer Hanssen) is equipped with several instruments that produce and record acoustic waves of various frequencies. The lower the frequency of the wave, the deeper we manage to penetrate the ground to gain a picture of the underlying structures. But the higher the frequency, the more detail we get. We used every instrument available to get a highly detailed 3D image of the underground.

    We collected geophysical data along 12 profiles and with the software onboard immediately produced spectacular “radiographies” of the Mother Earth’s submerged mountains and cracks beneath the seafloor in this remote part of the globe.

    We started with 2D surveys (the ship moves in a straight line). Everything went so smooth and the excitement about amazing data was such, that we decided to do a 3D survey (the ship moves in parallel and closely spaced lines and the recorded data is then interpolated to get a volume).

    To image deeper we use an air source that produces an acoustic signal with 20-500 Hz. For 2D lines, we connect the cables one after the other one (we refer to it as the green spaghetti).

    The green spaghetti (the hydrophone cables) is rolled out on the deck while we change from 2D to 3D mode.

    To image in 3D we put the cables one next to the other. Changing from one configuration to the other one implies a lot of action on deck for the crew, our engineers, ourselves and even our colleagues form AWI helped on deck pulling and connecting hydrophones for the surveys. Also, the processing team had a lot of action and a sufficient amount of data to keep us awake during the night shifts.

    Stormer and Steinar carefully dry and put leads in the hydrophone connectors while Henning and Vera (AWI) wait for the next hydrophone cable to role it into the box.

    It was a productive research cruise with a great crew and lots of inspiring moments. We had intense research discussions and collected significant data sets for the Seamstress project. Part of the new lines complement a data set we are using for a scientific drilling proposal (IODP).

    We sail satisfied to our next target before heading to our final destination: Home!


  • Searching for the unexpected signals in the deep sea

    Searching for the unexpected signals in the deep sea

    Text and photo: Andreia Plaza-Faverola, researcher CAGE; project leader SEAMSTRESS

    We started the cruise abiding by the law of the sea (we assisted a smaller ship that was in trouble). Luckily for the crew of the small ship and for ourselves, the weather was nice and the sea calm. Next, we collected the seven seismometers (five from Geomar, two from UiT) that were at the ocean floor since last year. Now it was time to launch  the next part of our experiment.

    This time we left 10 seismometers at the bottom, eight from AWI and two from UiT, distributed in a faulted region north of the Knipovich Ridge. In average the deployment of each instrument took about an hour. This included a test of the releasers. The releasers were placed in a cage and sendt down to 2000 meters water depth,  to check whether they were receiving the signal from the ship and responding with the task they were asked to do (open the hook!, close the hook!, send a signal back to the ship!, etc). Some of the releasers failed to obey in the last minute, almost like a child who refuses to do this and that. So they needed to be replaced (the releasers…). It was a long couple of days for all, in particular for those preparing the instruments to be thrown overboard.

    Henning (AWI) observes and ensures that the OBS is carefully lowered to the sea surface by the crew member who operates the crane. Photo: Andreia Plaza-Faverola.

    Placing the instruments at sea went smooth. Now we all wait until next year to recover the instruments and hope that they recorded small earthquakes originating from, or somehow related to, faults that show up at the seafloor. These in turn may be related to the opening of the Knipovich mid-Ocean ridge. Since shallow seismicity is not expected in the zone where the instruments sit,  what we really are hoping for is that the instruments will record something unexpected.

    Towards the end the whales were still with us and the wind was in our favour.

    From left to right: an instrument, the crew and a whale. Photo by Vera Schlindwein
  • A special kind of fishing trip

    A special kind of fishing trip

    Text and photos: Andrea Plaza-Faverola, researcher CAGE; project leader SEAMSTRESS.

    Seven ocean bottom seismometers (OBS) have been recording earthquakes for about a year at more than 1000 m water depth offshore the west-Svalbard margin. In a calm sea, surrounded by whales and dolphins we fished out one by one. We managed to retrieve all of the instruments.

    Each seismometer is attached with a hook to an iron frame that keeps them on the sea-bottom for the desired recording period. To bring them back to the surface they are released from their weight using an acoustic device that sends a signal from the ship through the water, and basically tells the hook to rotate to free the instrument so that it can float up. When one instrument is released, we are all out on the bridge looking for it to show up in the horizon.

    Sunil, Przemek, and Stefan enjoy the calm sea while waiting for the instrument to appear on the surface.

    When the OBS is at the surface one of the crew fishes it out and grabs it with the crane or picks it up using the dingy.

    Usually it takes about half an hour for one OBS to raise through 1200 meters of water. There is always a latent fear of not getting the instruments back to the surface. But once again the operation was successful, and we retrieved the seven instruments.

    An OBS picked up from the sea and safely placed back on the ship using a crane.


  • An altruistic beginning for SEAMSTRESS expedition

    An altruistic beginning for SEAMSTRESS expedition

    Text: Andreia Plaza-Faverola, leader. SEAMSTRESS project.


    The second expedition to continue with the Ocean Bottom Seismic (OBS) experiment for the SEAMSTRESS project, started in Tromsø on the 19th of August 2020. This part of the experiment aims at collecting the seismometers that have been recording seismic signals since last summer around the Vestnesa Ridge. We will also be placing new seismometers closer to the northern termination of the Knipovich mid-ocean ridge axis (check the map below). We are working closely with our colleagues from the Alfred Wegener Institute (AWI) in Germany. They bring the expertise on seismology as well as needed instrumentation.

    The west-Svalbard continental margin is very much closed to the active mid-ocean ridge and is thus a natural laboratory to study the impact of regional tectonic processes on shallow Earth processes, such as the release of methane to the ocean. Illustration: Domel/Vadakkepuliyambatta

    The continental margins are classified as tectonically active if one plate is colliding against another plate. They are classified as inactive if the continental plate is far away from the middle of the oceans (mid-ocean ridges) where new rocks are constantly produced. But what happens if a continental margin is not so far away from the mid-ocean ridges? This is what we are investigating. We are searching for small earthquakes along a supposedly inactive margin (the west-Svalbard margin). The presence of earthquakes originated at faults that are away from the mid-ocean ridge would indicate that the movement of oceanic plates at the mid-ocean ridges, spreads to fractures and broken parts of the continental plate along the so-called passive continental margins. Processes such as the release of methane to the oceans from these margins may be affected by tectonic movement from the oceanic ridges.

    We have been transiting to the Fram Strait for about 48 hours already. Before starting with the OBS experiment we plan to collect seismic lines that are needed to complete a proposal for the International Ocean Discovery Program (IODP).

    But not all is about pursuing scientific objectives. We are currently towing a small passenger boat that called for help because they got a rope (garbage floating in the ocean) entangled in their propeller. Our captain rescued them and will tow them until the coast guard takes over or until we can leave them in a safe place. We needed to postpone the first surveys and adjust the schedule. Most likely we will need to reduce the amount of data we collect this time but we will take with us a good feeling of solidarity.


  • We discovered new methane pingos in the Barents Sea

    We discovered new methane pingos in the Barents Sea

    Text: Pavel Serov, CAGE.

    We were not supposed to find gas hydrates (flammable ice-like crystals consisting of methane and water) in this CAGE cruise as the expedition objectives were slightly off gas hydrate topics. After 10-days, the long, all-consuming hunt for methane seeps and meltwater channels on the seafloor brought us to the very center of the Barents Sea.

    Many factors have to coincide to form a shallow gas hydrate accumulation: the water depth should be large enough, the temperature should be low enough, there should be a strong supply of methane gas, and some soft sediments should be available to accommodate hydrate. It clicks when you realize that a point you are looking at on the map has it all. It certainly clicked that day when we found a group of seafloor mounds bursting gigantic flares of methane bubbles (figure) rising through the thick and cold layer of seawater. Hydrates.

    Scanning the seafloor relief and overlying water gives us an idea about where methane gas is leaking from. That is where hydrates are likely to be found. Figure: Pavel Serov

    Some hours later we found ourselves preparing a 1000 kg metal pipe (a gravity corer), which we hoped would pierce the methane-bursting mound and reveal its content. The first attempt did not bring us any touchable evidence for burning ice, but plenty of smell. A strong smell of rotten eggs, terribly unpleasant, but very useful indicator of methane on the seafloor. It was worth trying again. The second gravity corer was certainly not empty. Hydrates and bubbling degassing sediments were sticking out from the pipe. That’s what we hoped for!

    It took minutes to seal the first gas sample and find a firecracker. One should prove that these white crystals are burning ice, and there is no better test than setting them on fire. After plenty of successful tests, it was time to retrieve the rest of the core from the protective plastic liner.


    With the help of the Helmer Hanssen crew and a disk saw (totally safe) the rest of the bubbling mud and layers of beautiful white hydrate became available for public view.

    Splitting the core linear. Normally it is done in the laboratory and using a special core splitter. Here we had to improvise. A disk saw came in handy. Photos by Henry Patton (CAGE).

    Sampling hydrates is good fun – they burn, they make bubbles, they melt, they fizz, they blow up glass bottles if you seal a piece in it. But feeling that your predictions of where to find them were right is even better

    Back in 2015, we proved for the first time gas hydrates in similar gas hydrate mounds (we call them pingos) in the western Barents Sea. It feels great to be a part of the team discovering another gas hydrate pingo field 5 years later. It means we have learned something about these methane-bursting beasts, we understand them better now. And we know how to find them.. – these were my last thoughts before falling asleep after a long shift on the hydrate day of the cruise.

    A layer of hydrate in bubbling sediments. Photo: Henry Patton


  • Coring under the Arctic midnight sun

    Coring under the Arctic midnight sun

    Text and photos: Lina Alexandropoulou, CAGE

    It’s Monday the 13th of July 2020, 13:54:09. According to the plan, the last core for this cruise has just been collected, processed, and put into cold storage waiting to be analyzed once back onshore. It has been an intense three days. Researchers, engineers, and crew members of R/V Helmer Hanssen joined forces for one main goal: to collect gravity cores. We faced several challenges, for example at one site the 6 m-long, steel barrel used for coring bent, proving that sometimes sediments can be too hard to core. Despite all this, by the end, we managed to acquire 20 gravity cores and recover a total of 52 meters of glacigenic and glaciofluvial sediments.

    The liner, filled with sediments, is out of the barrel and the team is ready to process the gravity core. Photo by Lina Alexandropoulou

    These sediment cores will form the basis for the GlaciBar research project led by Mariana Esteves, a researcher at CAGE, UiT. The main objective of this project is to characterize and constrain the timing of glacial retreat of the last Barents Sea Ice Sheet through Sentralbankrenna. This major trough hosted a fast-flowing and marine-terminating ice stream that shared many similarities with glaciers found in Antarctica today.

    When there is teamwork, great things can happen. In our case, 20 gravity cores and 52 m of sediment recovery. Photo by Lina Alexandropoulou

    Working on the deck is always fun especially when the weather is nice, like in our case, allowing us to enjoy the Arctic summer and the midnight sun (even though it prefers to hide behind the clouds). But wait, the research cruise hasn’t finished yet. Now it’s time to go back to the instrument room where new scientific surprises are waiting for us

  • Into the blue

    Into the blue

    Text and photos: Henry Patton, chief scientist

    Even by generous estimates, around 80% of the world’s oceans have not been surveyed – the surface of Mars is better mapped than our own planet. This fact rings true in the Barents Sea as well, where there are still vast areas where we don’t really know what the seafloor looks like. Imaging and reconstructing the landform imprint left behind by the last ice sheet is therefore much like trying to complete a vast unfinished jigsaw puzzle, where there are still more pieces left in the box than on the table.

    Here is one such jigsaw piece we found and surveyed this week. This impressive channel feature carried vast quantities of water beneath the ice sheet, which perhaps came via vertical pipes that captured meltwater from the ice-sheet surface above. Like in river systems that you see onshore, there are similar morphologies in these subglacial features too, including channel braiding and the occasionally connected lake basin.

    Knowing these features exist and that water was abundant gives us clues into what conditions were like at the base of the ice sheet, and into the processes of how the ice sheet eventually collapsed.

    Surveying the seafloor is a frustratingly slow process – to get images of sufficient quality we are sailing at less than 20 km per hour. However, the live data feed that comes in makes great ‘slow TV’ for geoscientists! From the warmth of the instrument room, it’s possible to be captivated for hours, watching as the glacial landforms slowly reveal themselves and never knowing what to expect next. Of course, there are many teasing features that we see along the way that would be great to visit, but time is limited and we must be patient and come back another year to add more pieces to the puzzle.

  • Birds will be birds

    Birds will be birds

    Text and photos: Frances Cooke, phd CAGE.

    I arrived in Tromsø in 2019 at the end of spring. It is this time of year that Tromsø’s inhabitants start preparing the exterior of their houses for the summer. This may include dust blowing, snow spreading, and for many putting up kite bird repellers to deter the seagulls. Currently out in the Barents Sea on the Helmer Hanssen there is no deterring the birds. Stein, one of the ship’s deckhands has designed his own bird deterrent.

    It has since been referred to as the bird scratcher, as a bird (pictured) has finely demonstrated. With the intent to scare the birds away, Stein’s bird deterrent became a favorite spot for the birds to rest. He is now working on an improved model.

    I haven’t always been a bird enthusiast. My fascination began when I started to work on ships in 2010. You develop a certain respect for them being out in the open ocean, forgetting that this is their natural environment and that they are, of course, adapted to these conditions.

    Early on in my career, I was working on a ship in the North sea. One morning I walked into the instrument room to find a pigeon standing there. It seemed quite happy so I let it be. It was no ordinary pigeon, it was well looked after – a homing or racing pigeon. I hadn’t expected a bird like that to come out to sea, I thought they found their way following roads or landmarks. I decided to keep an eye on it over the course of the day. I took a break and went to check on the new crew member, only to be told that it had just been caught and taken to the galley by the Indonesian cook. I asked what he might be doing with a bird in the galley, not thinking that someone would actually consider eating this pigeon. I ran to the galley. “What are you doing with the pigeon!” – “I’m going to cook it” he said. “..But you can’t do that, it belongs to someone!” I was relieved to find that the pigeon was alive and well. It was handed to me. The poor thing was so trusting, had no idea that some humans, knew nothing of its importance!

    Some years later I decided to place myself in a warmer part of the world – in Australia. I was on a ship with one of Tasmania’s highly regarded and most passionate marine ornithologists – affectionately known as ‘Bird Man’. He had dedicated his whole life to protecting birds and cared for them as much as one would their own children. I learned from him how to identify birds from their motion in flight. Some would flutter, almost butterfly-like and others would take advantage of the lift from the waves and tilt repeatedly from one side to the next dipping their wings right down to the water’s edge, with tremendous precision. Others would soar high above, like a kite, namely, the Frigatebird. To Bird Man’s dismay, I developed a distaste for this bird. The Frigatebird, also known as the ‘Pirate of the Sea’ is kleptoparasitic. Yes, you guessed correctly, it chooses prey that have recently fed, latches onto them, making them regurgitate their food, and then eats that regurgitated food. This is how they feed. It quickly adopted a new name that was banned from use on Bird Man’s watch – ‘The Frigging Frigate’.

    No penguins here. But are we seeing fish or flares?

    It was on a voyage to the remote sub-Antarctic Heard and McDonald Islands in 2016 that inspired my move to the Arctic – to CAGE, and not because of the penguins (..!) but they were an impressive part of the scenery. We were not there to study penguin colonies but to hunt for gas flares seeping from the seafloor. A notable difference in data collection here in the Arctic is the absence of water column disturbance from penguins streamlining through the path of the multibeam echosounder. There is a very high flaring activity in the Barents Sea and we are here monitoring that activity. There are many clues in the data that corroborate flare presence, for example, pockmarks or circular depressions found on the seafloor that are collapse features. There are fish that are known to make homes in these shallow craters. You may often hear, “Are we seeing fish or flares?” and where there are fish there will always be birds!

  • Into the heart of an ancient ice sheet

    Into the heart of an ancient ice sheet

    Text: Henry Patton, chief scientist.

    During the last ice age a vast, 3-km thick ice sheet covered much of Fennoscandia and the Barents Sea. Yet, around 15,000 years ago, its marine-based sectors collapsed catastrophically within a matter of centuries. One of the primary objectives for our team of 5 scientists and 2 engineers over the next two weeks will be to sail into the central Barents Sea to unlock some of the secrets behind how and why this ancient ice mass rapidly disintegrated.

    We left Tromsø on July 8th on-board the research vessel Helmer Hanssen, leaving behind the calm waters and sunny vistas of Lyngen and northern Troms. Our first study area is ‘Sentralbanken’, an area that lay at the centre of this Barents Sea ice sheet and where some of its last icy remnants persisted. The transit there is a long one, taking over a day to sail. However, this is not wasted time and there is always plenty to do in preparation, including making sure all the geophysical equipment is working, setting up the instrument room for processing incoming data, and refining our research plans. So far no hitches!

    Leaving Arnøya behind. Heading for The Barents Sea, Photo: Henry Patton

    Our route north has also been strategic, taking the opportunity to investigate potential areas of methane seepage from the seafloor, for example, where this ice sheet has eroded the constraining cap rocks; so far our predictions have proved very fruitful, with many newly discovered flaring locations.

    Preliminary data show methane flares where gas is escaping from the seafloor into the ocean.
    Preliminary data show methane flares where gas is escaping from the seafloor into the ocean.

    Once we reach Sentralbanken we will begin our plans to survey the glacial fingerprint left behind on the seafloor by the ice sheet, as well as collecting glacial sediments that will help unravel the deglaciation story here, including when the ice retreated and what conditions were like beneath the glacier. We keep our fingers crossed for some calm weather ahead.

  • Wrapped up on the way home

    Wrapped up on the way home

    After discovering new hot spots for methane release and collecting nice new data set, we are now ready to go home. On the transit to Tromsø, it is time to clean all the labs, tidy up our equipment, and prepare the list of what goes where once on land. It is also the perfect moment, when everybody is up, to take the inevitable group picture. We called our cruise “the first COVID cruise”, and the picture illustrates it well.

    I take the advantage of this post to thank all the crew members that did an amazing job recovering the lander (I think 25min is a record) without any hiccups despite strong winds, the engineers Truls and Stormer, and of course the scientific team for their quick reactions and good company!

    Till next time!

    Benedicte Férré, Chief Scientist

  • Hunting for flares

    Hunting for flares

    For the duration of this cruise, we are hunters. Not for wildlife, not for the perfect photo, and not even for treasures. Our target might not be a living organism but it is just as elusive and, as we will find out, difficult to track : we are searching for methane flares.

    Text and images: Marie Stetzler

    (more…)

  • Murphy’s law strikes in High Arctic

    Murphy’s law strikes in High Arctic

    According to the so-called Murphy’s law “If something can go wrong, it will. And usually at the worst time.”

    Text and images: Benedicte Férré

    (more…)

  • The last day

    The last day

    We ended the cruise in the Trondheimsfjord. After completing the program in the Vestbrona Volcanic Province with the discovery of a new cold vent with gas flares, carbonate crusts, and bacterial mats, there was nothing more to achieve than enjoy the scenery of Norway’s landscape.

    Text and photos: Jochen Knies, Chief Scientist.

    (more…)

  • You cannot work for 24 hours!

    You cannot work for 24 hours!

    What is the purpose of a research cruise, you may ask? Yes, spend the time wisely and get as much done as possible. The cruise leader’s responsibility is written in a manual, but if you face reality it is just another piece of paper.

    Text: Jochen Knies, chief scientist.

    (more…)

  • Paparazzi on the high seas

    Paparazzi on the high seas

    Being in the limelight can be so stressful, it can lead people to give up royalty.

    Text and photos: Arunima Sen, Nord University @BentohosEcology

    (more…)

  • Steaming south-southwest

    Steaming south-southwest

    After we finished the final ROV operations at the South Canyon in Lofoten around Monday midnight, the scientists were busy organizing the new samples in the early Tuesday morning.

    Text and photos: Tobias Himmler, researcher Geological Survey of Norway (NGU).

    (more…)

  • Midnight sun trip through amazing scenery

    Midnight sun trip through amazing scenery

    As I’m writing this, we’ve just finished our first-day onboard Research Vessel G.O. Sars.

    Text: Julie Heggdal Velle, a researcher in marine geology. Geological Survey of Norway

    (more…)

  • Leaving Tromsø onboard RV “G.O. Sars” on a brilliant summer day

    Leaving Tromsø onboard RV “G.O. Sars” on a brilliant summer day

    We set out for a journey, chasing the freshwater from an ancient ice sheet, on board “G.O. Sars” on June 6th on a brilliant day with sunshine and calm weather.

    Text: Jochen Knies

    (more…)